Sebastian Jacobs 11S
Mayfield statistics coursework
What we were asked:
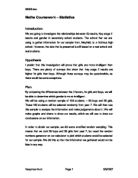
The task given to us is to study an excel spreadsheet which has various details about students and use this information in order to come up with a suitable hypothesis which will provide interesting results. In order to obtain our results we have to take a sample of the data provided (using a random sampling technique of our choice) because it's too big to use all of it.
What were my first thoughts:
My initial idea of what I could investigate was to study the comparison between the weight of a student and how many hours of television they watch per week. I would do this for a sample of each year group and then compare the results I found. I was going to take a random sample of 10 boys and 10 girls from each year making a total of 100 pieces of data to use. I did start this investigation but after analysing the data I realised that the results were not conclusive. I decided to abandon this idea because of my findings.
I also looked at my own family and I for example watch a lot of television but also do a lot of active things which may help to keep me thin, so watching lots of television doesn't always have much relation to your weight since your weight is based on four main factors, diet, genes, metabolism and amount of exercise.
My Chosen Investigation:
I finally decided that I am going to investigate the comparison between the weight and height of girls in year 7. Once I have completed this I am going to use the same process to compare the weight and height of boys in year 7. My hypothesis is going to be that the girls are taller and also weigh more than the boys in year 7. I think I will find this because girls mature physically earlier than boys, so I should be able to show this if I compare the height and weight ratios in year 7 with those of the boys in the same year. I expect both the average height of the girls and the average weight of the girls to be greater than the equivalent average for the boys. I am also going to extend my investigation to include the year 11 students. I will use exactly the same method and see how the conclusions vary between the boys and girls at this stage in their school life. As a result of extending my investigation I need to refine my hypothesis. My hypothesis will now be that even though the girls average weight to height ratio is greater than that of the boys in year 7, by year 11 the boys will now have matured physically and will have caught up with the girls in weight and height and the majority would have overtaken them, in fact the average weight to height ratio of a year 11 boy will be significantly greater than the average weight to height ratio of a year 11 girl. I have also considered how image conscious some girls are by year 11 and that they may keep their weight artificially low because of social pressure to be slim.
Once I have completed this I can then make clear comparisons between the difference between boys and girls in year 7 and the boys and girls in year 11 to see if my findings from the data in year 7 are similar to the results from year 11. I will compare the results of my samples from year 7 boys with year 11 boys to see how they differ. I will also repeat this with the girls. I then intend to compare year 7 as a whole with year 11 as a whole to see how their weight and height has progressed through the years.
Mayfield statistics coursework
What we were asked:
The task given to us is to study an excel spreadsheet which has various details about students and use this information in order to come up with a suitable hypothesis which will provide interesting results. In order to obtain our results we have to take a sample of the data provided (using a random sampling technique of our choice) because it's too big to use all of it.
What were my first thoughts:
My initial idea of what I could investigate was to study the comparison between the weight of a student and how many hours of television they watch per week. I would do this for a sample of each year group and then compare the results I found. I was going to take a random sample of 10 boys and 10 girls from each year making a total of 100 pieces of data to use. I did start this investigation but after analysing the data I realised that the results were not conclusive. I decided to abandon this idea because of my findings.
I also looked at my own family and I for example watch a lot of television but also do a lot of active things which may help to keep me thin, so watching lots of television doesn't always have much relation to your weight since your weight is based on four main factors, diet, genes, metabolism and amount of exercise.
My Chosen Investigation:
I finally decided that I am going to investigate the comparison between the weight and height of girls in year 7. Once I have completed this I am going to use the same process to compare the weight and height of boys in year 7. My hypothesis is going to be that the girls are taller and also weigh more than the boys in year 7. I think I will find this because girls mature physically earlier than boys, so I should be able to show this if I compare the height and weight ratios in year 7 with those of the boys in the same year. I expect both the average height of the girls and the average weight of the girls to be greater than the equivalent average for the boys. I am also going to extend my investigation to include the year 11 students. I will use exactly the same method and see how the conclusions vary between the boys and girls at this stage in their school life. As a result of extending my investigation I need to refine my hypothesis. My hypothesis will now be that even though the girls average weight to height ratio is greater than that of the boys in year 7, by year 11 the boys will now have matured physically and will have caught up with the girls in weight and height and the majority would have overtaken them, in fact the average weight to height ratio of a year 11 boy will be significantly greater than the average weight to height ratio of a year 11 girl. I have also considered how image conscious some girls are by year 11 and that they may keep their weight artificially low because of social pressure to be slim.
Once I have completed this I can then make clear comparisons between the difference between boys and girls in year 7 and the boys and girls in year 11 to see if my findings from the data in year 7 are similar to the results from year 11. I will compare the results of my samples from year 7 boys with year 11 boys to see how they differ. I will also repeat this with the girls. I then intend to compare year 7 as a whole with year 11 as a whole to see how their weight and height has progressed through the years.