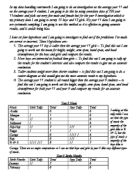
Year 11 Eye Colour
Out of 30 boys and 30 girls a majority of their eye colour is brown. 23\30 pupil’s eye colour is brown, and overall theirs not much difference between the boys and girls.
Year 11 Music
Looking at this table I can see that overall a majority of the pupils like R&B, But a majority of the boys like garage and a majority of girls like R&B.
Year 11 Interests
Looking at the tally table for the 30boys and 30girls surveyed in interests I can see that most of the girls like TV and most of the boys like football, but overall there are no major comparisons so the boys and girls interests are very different.
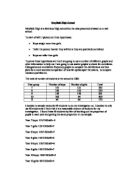
My final hypothesis is that the average year 11 student is overall bigger than the average year 9 student, but I am going to investigate to see weather this hypothesis is true or not. I am going to do this by doing the same tables as I did for year 11 students.
My sampling will be 15 girls and 15 boys as this is my primary data as I surveyed my class.
Mean
Height
Looking at this table of mean height, I can see that the average year 9 boy are taller then the average year 9 girl.
Arm Span
Looking at this table of mean arm span, I can see that the average year 9 girl has a longer arm span then the average year 9 boy.
Hand Span
Looking at this table of mean hand span, I can see that the average year 9 boy has a bigger hand then the average year 9 girl.
Head Circumference
Looking at this table of mean head circumference, I can see that the average year 9 boy has a bigger head then the average year 9 girl.
Weight
Looking at this table of mean weight, I can see that the average year 9 boy weighs more then the average year 9 girl.
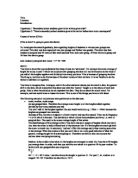
I am going to be investigating the average year 11 student in Copland Community School.
I am going to use the results of a survey of 200 year 11 students.
- My first hypothesis is that boys are taller then girls.
- My second hypothesis is that more boys like football than year 11 girls.
- My third hypothesis is taller student’s weight more than shorter students.
My sampling will be 15 boys and 15 girls this is because 10% is a bit more than the total student’s surveyed. I am going to choose every 5th boy and every 5th girl on a data sheet. I am going to do systematic sampling to avoid bias.
Mean & Range
Height
This table shows on average boys are taller then girls, but the range of the boys is only slightly higher then the girls range.
Weight
This table shows that boys are heavier then girls, but the range of boys are only slightly higher then the girls weight range.
Arm Span
Looking at this table I can see the boys mean arm span is longer then the girls means arm span, but the girls range is slightly higher.
Hand Span
Looking at this table the boys have a higher mean hand span then girls and boys also have a higher range.
Head Circumference
By looking at this table I can see that the boys head circumference is bigger but the girls range is a lot higher.
Conclusion
Overall looking back at the tables for Mean & Range for the average year 11 student the average boy is all round bigger then the average girl.
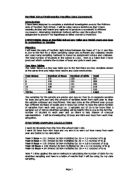
Year 9
Boys Height
Key
15/1 means 151cm
Girls Height
Key
15/1 means 151cm
By looking at these stem and leaf diagrams I can see the majority of the heights are in the 170cm category. This means that the boys and girls are quite tall.
Year 9
Boys Height
Key
16/8 means 168cm
Girls Height
Key
15/9 means 159cm
By looking at these stem and leaf diagrams the majority of the boy heights are in the 170 cm and a majority of the girls heights are in the 160 cm. This means that the average year 11 boy is taller then the average year 11 girls.
Year 11
Height
Year 11 Girls
Mean = 186.6
Year 11 Boys
Mean = 176.1
By looking at these grouped mean tables I can see that the average year 11 boy is taller then the average year 11 girl.
Year 9
Height
Year 9 Boys
Mean = 167.45
Year 9 Girls
Mean = 162.75
By looking at the grouped mean heights for the boys and girls I can see that on average the boys are taller then the girls. I can see this as the boys heights are mainly recorded in the 170-174.9 columns whereas the girls have been mostly recorded in the 160-164.9 columns.
Conclusion
Looking back at my hypothesis for the average year 11 student I can see through my results that boys are taller then girls by far but by looking back at the range for boy’s heights they are more spread out then the girls. For my second hypothesis I was also correct as the result would identify that more boys like to play football then girls. In my third hypothesis which was that taller student weigh more on average then shorter students and looking back at my scatter diagram of this my result are accurate enough to back me up on this although there did appear to be two outliers which could be possible errors. I think that doing systematic sampling gave me accurate results and helped me to avoid bias.
Looking back at my hypothesis for the average year 9 student by looking at my results I can see that I was correct to predict that the overall the average year 11 student is all round bigger then the average year 9 student as when I compared the two years results I could clearly see that the average year 11 student is bigger then the average year 9 student.