mn = the mean of n results
Generally the second expression should be used for analyzing statistical data and this is the formula I will use. The first expression is only valid for theoretical, ideal cases.
RESULTS
KeyStage 2 Results
Here are the results for the first part of my investigation:
MEAN KS2R
Mean KS3R for boys = 4.05
Mean KS3R for girls = 4.11
MODAL KS2R
Modal KS3R for boys = 4
Modal KS3R for girls = 4
MEDIAN KS2R
Median KS3R for boys = 4
Median KS3R for girls = 4
RANGE OF KS2R
Range of KS3R for boys = 3
Range of KS3R for girls = 2
Standard Deviation
Standard deviation for boys = 0.77
Standard deviation for girls = 0.71
Analysis
From the results it can be seen that girls do have a slightly higher mean average than boys indicating that the results were slightly higher for girls. Additionally, there were no girls from my sample scoring lower than 3, which meant the spread of data was less dispersed than the boys as there were 3 boys scoring lower than 3; the range for the boys KS2R to be 3 and the girls range only 2. The evidence from the sample suggests that generally there will be fewer girls with scores lower than 3 than boys.
The mode and median values were the same for both boys and girls. This, however, should not suggest that the boys and girls results were so similar. The limited possible ‘levels’ (i.e. level 1,2,3,4 or 5) consequently resulted in similar mode and median values over the sample.
In conclusion, although the median and mode values were the same for both the sexes (explained above), the evidence suggests that overall, the girls did better at KS2 than boys due to a higher mean average. Furthermore, the bar chart (see appendix 1.2) clearly indicates girls are more consistent and situated more towards the top end of the levels than the boys. This would be firmly supported by the mode and median if KS2R were given more accurate grades rather than general ‘levels’.
IQ
Here are the results for IQ for both girls and boys:
MEAN IQ
Mean IQ for boys = 102.24
Mean IQ for girls = 101.07
MODAL IQ
Modal IQ for boys = 102
Modal IQ for girls = 102
MEDIAN IQ
Median IQ for boys = 102
Median IQ for girls = 102
RANGE
Range for boys = 47
Range for girls = 54
MODAL CLASS INTERVAL
Modal class interval for boys = 100 ≤ IQ < 110
Modal class interval for girls = 100 ≤ IQ < 110
Standard Deviation
Standard deviation for boys = 9.70
Standard deviation for girls = 10.69
Analysis
Looking at just the mean average, it is clear that boys have a higher IQ than girls. The boys mean IQ being 1.17 more than the girls. But, as in KS3R, the modal and median values are the same. This shows us that although the boys have a higher mean average, because there are more boys scoring lower than70 than girls, and there are more girls scoring more than 120 than boys, this evens out the median value. This similarity is also assisted by, once again, a limited number of IQ ‘groups’.
If I were to repeat the investigation I would narrow down the groups (e.g. 100 ≤ IQ < 105 instead of 100 ≤ IQ < 110) to create a bigger dispersion to make my results more reliable.
In conclusion, although the median values were the same for both sexes, because the range was smaller for boys (meaning more boys closer to the median value than girls) and the mean average was higher for boys, the evidence suggest that in general, boys are ‘smarter’ than girls (have higher IQs). This is fortified by the Histograms (see appendix 2.1 and 2.2) where it is clear that the IQs that fall between 90 and 120 are greater in numbers for boys than girls.
FURTHER INVESTIGATION
Now that I have analysed IQ and KeyStage 2 Results separately I shall extend my line of enquiry to test a hypothesis.
I shall test the following hypothesis:
“IQ is comparative to KeyStage 2 Results and therefore I shall be able to predict a persons IQ by looking at their KeyStage 3 Results”
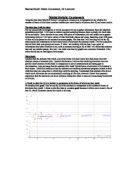
I shall start by plotting KeyStage 2 Results against IQ on a scatter diagram (see appendix 3.1 for scatter diagram).
From this scatter diagram its is clear that there is positive correlation between IQ and KeyStage 2 Results. This meant it was possible to draw a line of best fit (going through the mean). From the line of best fit I can now predict IQ from KeyStage 2 Results. For example, I can predict a person with an average KeyStage 2 Result of 3 will have an IQ of 86.
GENDER
In the early part of the investigation I found evidence to suggest that that IQ and KeyStage 2 Results are both affected by gender. A natural step now is to extend the line of enquiry to investigate how the correlation between IQ and KeyStage 2 Results is affected by gender. I will test the hypothesis:
“There will be better correlation between IQ and KeyStage 2 Results if we consider boys and girls separately”
I now have to plot IQ against KeyStage 2 Results on separate scatter graphs for boys and girls (see appendix 3.2 and 3.3 for scatter diagrams).
It is apparent from both the scatter graphs that there is no quick way of proving the hypothesis either right or wrong and to do so a calculation must be made to work out the equation of each line of best fit and then use the equation to predict IQs from KeyStage 2 Results and see if separating the sexes made our predictions more accurate.
BOYS
Y = mx + c
m = y1/ x 1
y = 26, x = 2
26/2 = 13
c = 52
So the equation for the boys Line of best fit is:
Y = 13 x + 52
The equation for the girl’s line of best fit is:
Y = 12 x + 49
The equation for the mixed line of best fit is:
Y = 16 x + 42
Average IQ per KeyStage2 Result (MIXED)
KS2 RESULT AVERAGE IQ
2 71
3 84
4 102
5 117
These equations show us that although the hypothesis was wrong in saying the separate graphs would show better correlation, they did show us more accuracy in predicting IQ from KeyStage 2 Results, proving that gender does have effect on both IQ and KeyStage 3 Results.
I am, however, aware of the limitations of using the best fit line. It is a best estimation of relationship between IQ and KeyStage 2 Results. But there are exceptional values (such as the girl whose average KeyStage 2 Result was 3 and has an IQ of 99) which fall outside the general trend. The line of best fit is a continuous relationship, though IQ is a discrete variable. Rounding IQ to the nearest whole number makes my prediction less accurate.
FINAL SUMMARY
The sample of 10% stratified over gender shows a mean IQ of 102 for the boys and 101 for the girls. Also, the range of IQs for the boys was considerably less than for the girls. This suggests that there will be many girls who score less than 102, the boys mean score.
However, while the mean IQ scores are more-or-less the same for both sexes, the standard deviation for boys is greater than that of girls, which implies boys are more erratic when it comes to such a test compared with themselves.
Of the KeyStage 2 Results, the mean score for both sexes was 4 but the range for the girls was less suggesting that there will be more boys scoring lower than 4, than girls. All this suggests that, on the whole, girls do better than boys at KeyStage 2 level.
The evidence suggests that boys generally have a higher IQ than girls, but girls achieve better grades at KeyStage 2 level. This could be down to girls working harder than boys to achieve higher scores, as my original statement suggests (see introduction).
There is a positive correlation between IQ and KeyStage 2 Results as a whole. This correlation is not ‘improved’ when boys and girls are plotted on separate graphs although the accuracy of the line of best fit does increase.
Over the full range of IQ and KeyStage 2 Results it was decided that a line of best fit was the most suitable model to describe the relationship between IQ and KeyStage 2 Results as they are proportionate to each other.
It was also decided that cumulative frequency graphs were not suitable to draw any conclusion from because it was felt that the KeyStage 2 Results and IQ categories were of a limited range (i.e. only Levels 2-5).
If I were to investigate further, I would consider the different year groups independently to make my results more accurate and maybe take a larger sample size to increase reliability.
APPENDICES