A confidence interval gives an estimated range of values which is likely to include an unknown population parameter, the estimated range being calculated from a given set of sample data.
If independent samples are taken repeatedly from the same population, and a confidence interval calculated for each sample, then a certain percentage (confidence level) of the intervals will include the unknown population parameter. Confidence intervals are usually calculated so that this percentage is 95%, but we can produce 90%, 99%, 99.9% (or whatever) confidence intervals for the unknown parameter.
The width of the confidence interval gives us some idea about how uncertain we are about the unknown parameter (see precision). A very wide interval may indicate that more data should be collected before anything very definite can be said about the parameter.
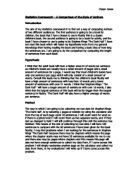
We have already used the table of the Standard Normal Distribution to obtain values of from a known value of z, or vice versa. Actual populations rarely, if ever, conform exactly to the Normal Distribution model. The Central Limit Theorem allows us to use it as a workable approximation for means of samples of sufficient size. For instance, for z N(0, 1) and z = 1.96, we find that = 0.975. This tells us that 0.975 (97.5%) of a Normal population is to be found on one side of the mean plus 1.96 times the standard deviation. Alternatively, we might say that any single value drawn from this population has a 97.5% probability of lying within the interval
-∞< z ≤1.96σ. This is referred to as a single-tailed test.
Samples are drawn to provide useful information about their parent population. There is a starting assumption that a randomly drawn sample will be representative of its source. How much confidence can be invested in the sample-derived estimates of population parameters (means, variances, etc.) will depend on the sample size. It will also depend on our degree of knowledge of the standard error of the statistic considered.
An average value is expected to vary from the population mean. It will be useful to quote it as a range within which we are confident that its true value can be found. To do this, it is necessary to combine the range with an associated probability quantifying our degree of confidence.
My prediction is that, ‘The Wizard of Oz’ is quite more complex than ‘The Patchwork Cat’. I purely judged this by scanning through the book and looking at its sentence lengths and length of words, it seems more complex then the ‘The Patchwork Cat’. ‘The Patchwork Cat’ seems more readible and seems that it is more aimed for at younger readers, the storyline is more simpler and basic. However, ‘The Wizard of Oz’ has got a more complex storyline and requires a more understanding knowledge of the book. The readers of both the books are aimed at quite similar audiences, but it varies between that audience, where ‘The Wizard of Oz’ is higher in that target audience.
Sampling Results
These are the results that I got from my sampling. From the samples I will then conduct the mean, variance, standard deviation, standard error,
Wizard of Oz
The Patchwork Cat
Calculations for sentence length
The Wizard of Oz:
Mean (x) Σ x = 13.9
n
Variance Σ ( x-x )² = 13.622
n
Standard deviation Σ ( x-x )² = 7.844
√ n
Population Variance n S² =
n-1
Standard error = θ² = 1.109
√ n
95% confidence interval 13.9 + 1.95 x 1.109 = 30.059 or –11.74
99% confidence interval 13.9 + 2.58 x 1.109 = 16.76 or –11.039
The Patchwork Cat:
Mean (x) Σ x = 9.84
n
Variance Σ ( x-x )² = 9.643
n
Standard deviation Σ ( x-x )² = 3.559
√ n
Population Variance n S² =
n-1
Standard error = θ² = 0.503
√ n
95% confidence interval 9.84 + 1.95 x 0.503 = 10.82 or –8.859
99% confidence interval 9.84 + 2.58 x 0.503 = 11.14 or –8.542
Calculations for word length
The Wizard of Oz
Mean (x) Σ x = 4.82
n
Variance Σ ( x-x )² = 4.7236
n
Standard deviation Σ ( x-x )² = 1.85
√ n
Population Variance n S² =
n-1
Standard error = θ² = 0.262
√ n
95% confidence interval 4.82 + 1.95 x 0.262 = 5.33 or –4.31
99% confidence interval 4.82 + 2.58 x 0.262 = 5.49 or –4.14
The Patchwork Cat
Mean (x) Σ x = 4.52
n
Variance Σ ( x-x )² = 4.4296
n
Standard deviation Σ ( x-x )² = 1.418
√ n
Population Variance n S² =
n-1
Standard error = θ² = 0.20
√ n
95% confidence interval 4.52 + 1.95 x 0.20 = 4.91 or –4.13
99% confidence interval 4.52 + 2.58 x 0.20 = 5.036 or –4.004
I calculated each set of data’s mean, variance, standard deviation, population variance, standard error, confidence intervals for both 95% and 99%. From obtaining my results, I have established that out of both of the books, ‘The Wizard if Oz’ was the more complex book to read. I found this out by comparing each set of results to each other, comparing the sentence lengths of each book and the word length of each book.
‘The Wizard of Oz’ the average mean of the sentence lengths is higher than ‘Patchwork Cat’ which means that the average length of a sentence is greater than the other book. The standard deviations are higher in ‘The Wizard of Oz’ and are further away from the mean, so that it is widely spread, whereas the ‘Patchwork Cat’ is compacted around the mean and much closer.
For the word lengths, the average mean of both of the the books were very close. If you had to round them up to a whole number, they would be the same number. Also the standard deviations are also very close.
I firstly calculated the mean, standard deviation and standard error from the data that I collected from the two books. Through my results I found out that the mean sentence length for ‘The Wizard of Oz’ is greater in size than ‘Patchwork Cat’, and also so is the standard deviation. This tells me that ‘The Wizard of Oz’ is more complex than ‘Patchwork Cat’ because that sentence length is longer and would be more difficult for a younger person to read. The mean for the word length and standard deviation is also greater for ‘The Wizard of Oz’. This proves that this book has more complex sentences and words, as the words are longer in length. The word lengths were quite similar between the two books, but ‘The Wizard of Oz’ still took the lead with the word length. The standard deviation’s were also especially close with only a 0.4 difference between the two.