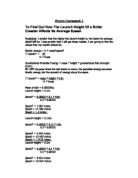
√2GH = V
M = Mass
V = velocity
G = gravity
H = Height
I have used the equation
√2GH = V
For example V = √2 x 10 x 0.1 = √2 = 1.4
My table shows that the higher the ramp the higher the velocity becomes this proves that my prediction was right.
We took a ruler and measured 0.01 on are ramp stand, than we took a long piece of wood which we used for a ramp. We used the same person to measure the heights each time, the same person to use the stop clock and also the same person to send the trolley down the ramp. We did each experiment five times and worked out the average. I also chosen the anomies results and deducted them from producing the average.
= anomalous result
My graph shows that my prediction was right and that when the height of the ramp increases, the average speed over the run off distance increases also. From my experiment I have collected results that show as the height increases also the average speed increases
For example:
At 0.1m the average speed was 0.769m/s
But at 0.5 the speed was 2.770m/s
This backs up me prediction because I said that “I predict that as the height of the ramp increases the average speed of the trolley over the run off distance will increase”.
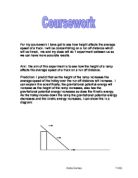
The measurements that I am going to use are in the diagram below,
I have chosen this run-off distance because I have predicted that 0.1m and 0.5 will both go over two meters so that I will be able to time them all I have chosen between 0.1m and 0.5m for the height to use in this experiment because they are reasonable and because I have chosen measurements with equal measurements between them so that hopefully I will be able to get a line of best fit on my graph.
I am able to make this experiment a fair test by using the same trolley, run off distance, the heights of the same are of the same equal distance and also using the same timer. The only thing that I cannot control is the friction on the wheels against the ramp, any problem or any sort of dust could affect the friction on the wheels. I could prevent this, or reduce it by polishing the ramp before each time that we send the trolley down the ramp.
In my prediction I said that “the higher the ramp the faster the average speed will increase”. I believe this is right because when the height is at 0.10 meters the average speed is 0.769 and at 0.50 meters the average speed is 2.77 this is a big difference in average speed. I chose the anomalous results from my table of results to reach a more accurate average speed. This proves that my prediction was right as when the height increases so does the average speed. Also when the height increases so does the gravitational potential energy, and because the gravitational potential energy increases so does the kinetic energy, I can show you this in my diagram:
My results support my prediction, as my graph of average results show that as the height increases so does the speed. I did each height 5 times so tat I can get a accurate average also I removed any anomalous results so that my average results are more accurate. I picked the anomalous results by taking the results that do not match the pattern e.g. 1.03, 0.85, 0.86, 1.04 I would take the 0.85 and the 0.86 as these are the results that do not match the pattern. I averaged the results so that so that I could have a even graph that my line of best fit goes through most of my results this also makes it easer to draw a conclusion from it. I also used a wide range of heights so I could produce a fair graph and we have a large range of results.
The main source of error in my experiment is human reaction; this is not a huge problem as I can not control this. We also had a few other errors that we also cannot control, these are:
- Measurements of time is only to two decimal places
- The trolley also sometimes did not go straight down the ramp
- The high was only as accurate as the people who measured (human error)
- Also the timing is also as accurate as the person who measured the time on the stop watch.
A suggestion of how to improve the experiment is light gates, her is a diagram:
This will make the experiment more accurate
Example: 3.32, 3.33, 3.32, 3.34.
Also with the computer taking the measurements it will be more accurate by producing more decimal places for a more accurate average speed. Also this way there is no human error. This is the main source of error.