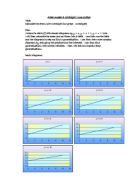
This answer however is only a very rough estimate and there is a high possibility of human error. When I was counting the half squares I counted every square that the line passed through and this means that it is not very accurate to just divide the answer by 2 because the half squares were not equal sizes and to just divide by 2 would be very inaccurate.
Counting Rectangles
The next method I will use should be more accurate than the counting squares method. I will split the curve into 5 rectangles and calculate the area of each separately and then add them together. This will hopefully give me a still rough, but more accurate estimate of the area under the curve.
Rectangle 1 – 1x2 - 2cm
Rectangle 2 – 9x2 -18cm
Rectangle 3 – 25x2 - 50cm
Rectangle 4 – 49x2 - 98cm
Rectangle 5 – 81x2 - 162cm
330cm
When all the areas of the rectangles are totalled up, they are equal to 330cm . I must now multiply this number by 2 to in order to give me the area for both sides of the parabola.
330cm x 2 =660cm
This method is still not entirely accurate but gives a more accurate value for the area under the curve than the counting squares method.
Counting Trapeziums
The method I have chosen to use now will increase the accuracy even more by splitting the curve up into trapeziums. I will split the curve up into 3 trapeziums and one triangle to find an even more accurate value for the area under the curve.
The formula I shall use to find the area of a trapezium is:
Area = sum of parallel sides x height
2
Trapezium 1 = 4+16 x 2 = 20
2
Trapezium 2 = 16 + 64 x 4 = 160
2
Trapezium 3 = 64 + 100 x 2 = 164
2
Triangle = 2x4 = 4
2
Total = 20 + 160 + 164 + 4 = 348
Again I will multiply this by 2 to give the area for both sides of the parabola
348 x 2 = 696
This method is again, more accurate than the last but is still not precise because there is a lot of space that is left between the line of the trapezium, and the line of the curve. This is a problem that would make the area value to big. The only way to improve this method to make it more accurate would be to increase the amount of trapeziums the curve is split into in order to reduce extra space between the trapezium line and the curve line.
The Trapezium Rule
I will now use a formula to accurately find the area of trapeziums. This will increase accuracy even further by measuring more trapeziums and the formula ensures a closer degree of accuracy.
The formula I will use is: (y0 + 2y1 + 2y2 + 2y3 + y4)
y represents the different point along the curve and is multiplied by 2 because it represents the sides of 2 touching trapeziums.
This formula will reduce the amount or excess space and make the results more accurate.
(8+32+72+128+100) = 340
Again I must multiple this by 2 to the get the area for both sides of the curve.
340 x 2 = 680cm
This result seems far more accurate because it is smaller than the first trapezium method I used, showing that the amount of excess space has been reduced, which means that the results are likely to be more reliable.
Simpson’s Rule
Simpson’s rule is like the trapezium rule only it uses more trapeziums and a more complicated formula. It is more complicated and can be used on any curve rather than the trapezium rule which only works on straight curves.
The rule is: 1/3 D (y0 + 4y1 + 2y2 + 4y3 + 2y4 + 4y5 + 2y6 + 4y7 + 2y8 + 4y9 + y10)
D stands for the width of each trapezium, which in my case is 2.
1/3 x 2 (0+4+4+36+32+100+72+196+128+324+100) = 332
Again I must multiply this by 2 in order to get the area for both sides of the curve.
332 x 2 = 664
I think that this is the most accurate rule because it uses most points on the curve allowing more accurate results because it allows the line to follow the curve closer than if there were fewer points as my previous trapezium methods have shown. . It has a lower result than previous trapezium methods, which shows that it has the least excess space between the trapezium and the curve line.
Conclusion
The first method I used was good for rough estimating but was very inaccurate when trying to calculate the area exactly. My second method although seemed again, a rough estimate, came closest to the result I achieved from Simpson’s rule. This may have been because although there was a lot of excess space, there was a gap at the top of the final rectangle, which may have made up for it. The next method I used was very inaccurate and gave a value that was too large. My next trapezium rule was all right and gave a closer value to the answer but the overall best method was Simpson’s Rule. It gave a value that was accurate because of using more trapeziums and therefore had the least excess space between the trapezium line and the curve. This is probably the closest result I could get when using straight-line formulae such as trapezium rules to calculate the area under a curve.


