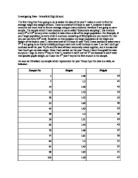
The data is now combined from the two groups in year 10.
Height of pupils in sets for and 5
Weight of pupils in sets for and 5
Hypothesis
From my sample, I am now able to look at the data in more detail. I will extend the line of enquiry and give myself a hypothesis to test. A hypothesis is a statement that could be true or false. I will test my hypothesis be looking at data and graphs.
I will extend my investigation by looking at the difference in height and weight between the pupils in year 10. I will test to see if the following hypothesis is true:
In general the taller the person, the heavier the person gets.
Tables for mode, mean, median and range
F means the frequency, mid point is the middle point between the height value, Fx is the frequency multiply mid point and CF is the cumulative frequency.
Modal = 160< x <165, (F 12)
170< x <175, (F 12)
175< x <180, (F 12)
Mean = 171.7156863
Median = Set 5 = 171 Total = 172.5
= Set 4 = 173
Range = Set 5 = 25 Total = 29
= Set 4 = 25
Modal = 50< x <55 (F 10)
1
Mean = 61.47058824
Median = Set 5 = 69.5 Total = 60
= Set 4 = 56
Range = Set 5 = 41 Total = 71
= Set 4 = 69
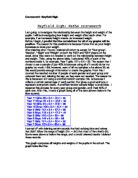
From observing the scatter diagram and line of best fit we can say that there is a positive correlation between the height and weight. This suggests that the taller the person is, then the heavier he will be. I used the “he” because the whole data handling was based on only male pupils in Desborough School.
With the line of best fit, we can estimate that some body who is 175cm tall they will have a body weight of 70kg. From looking at my graph, I have found out that my hypothesis of “In general the taller the person, the heavier the person gets.” Was in fact true.
Every straight line has an equation of the form y = mx +c. So I can find the equation of my line of best fit by finding its gradient and looking at the point where they intercept.
Finding the equations on my graphs
To find the equation for the line of best fit I know it will be in the form ‘y = mx + c’ m = gradient, c = y intercept.
First I will need to find the gradient.
Vertical
Horizontal = Gradient.
I took two sensible points along the line of best fit, combined them to form a triangle and then measured in units the vertical and horizontal which are also known as change in Y and change in X axis.
Once I had found the gradient, I have worked out m in the equation, y = mx +c.
So, the
Vertical 4
Horizontal = 12 = 0.333
From finding the gradient, which is 0.333 making sense because I used different units, we can now find the full equation to,
Y= mx + c.
Inserting the gradient, which is placed in m. Then where the graph crosses the Y-axis this will be the value of c.
We would finally have an equation of,
Y= 0.333x + 160 This will be used to find an estimate of any pupils height in year 10 by giving their weight in kg.
So, I could say to find out a boy who has a weight of 64kg I could use the equation to give a rough estimate of his height in Cm.
Y= 0.333 * 64 + 160 would equal to 181cm as an estimate. By looking at my line of best fit I can say that my answer was only 7cm away from its best fit.
I can work out an estimate of the weight of a pupil in year 10 by rearranging the formula.
X = y –160
0.33
Conclusion
My investigation was to find out the relationship between the height and weight of the pupils in Desborough School. All the pupils were male so there were no gender factors. My hypothesis was that the taller the person gets, the heavier they would become. The hypothesis was correct by observing the scatter diagram it was not an accurate result but it was a positive correlation for the line of best fit. From the line of best fit, I then decided to find the equation for this line.
Using the formula = mx + c, I was able to find out the equation. First I had to find the gradient. This was shown in the process in my coursework. The final equation was figured out which was Y= 0.333x + 160