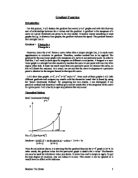
The Change in y = 2 = 4
The Change in x = 0.5
The answer to the gradient of the tangent at x=1 is 4. As you can see by looking at the graph, another set of co-ordinates have been plotted to discover the change in x and y on the tangent at x=-1.
As you can see from the graph, the change in x is 0.5, and the change in y is once again 2. As these are the same as when the tangent is at x=1, we can safely say that the gradient will be the same, but with one modification. As the tangent at x=-1 is travelling in a downward position, and the co-ordinates are located in the upper left quadrant of the graph, it will give us a negative gradient. This simply means that the gradient of the tangent at x=-1 will be -4.
I have also spotted a pattern in the curve of y=2x2. As you can see from the previous results of this curve, when the tangent is at x=1, the gradient has been discovered as 4. When the tangent is at x=-1, the gradient has been worked out as – 4.
As you can see from these results, the gradient function for the curve y=2x2, is 4x. I can now relate back to my results when I investigated the curve of y=x2. The gradient function of that curve was 2x. The gradient function of the curve I have just been investigating is 4x.
I have spotted a pattern between these two results. They have basically added another 2 of x. I am going to predict that this will occur again, in the curve of y=3x2. I am therefore predicting, that the gradient function of y=3x2 will equal 6x.
Below is the table of values for the curve y=3x2:
Once again, below I have drawn out the graph of y=3x2 using Omnigraph for Windows.
Once again, I have drawn the curve in blue for convenience. Once again, I have decided to investigate two tangents of this curve. The tangent in red is the tangent at x=0.8 and the green tangent is the tangent at x= - 0.5. The units between the points, I have plotted to find the gradient, I have marked in bold or italic, depending on which tangent it belongs to. To begin with, I will investigate the tangent in the upper right quadrant, which is the tangent at x=0.8.
To find the gradient of the tangent at x=0.8, I am going to substitute the change in y and x values into the equation I stated, at the top of the first page of this investigation.
The Change in Y = 2 = 5
The Change in X = 0.4
As you can see, this answer is not accurate. If you work out the sum of the tangent at x = 0.8 x 6 of x, it will be 0.8 x 6 = 4.8. The gradient is actually 4.8, however as I explained at the beginning of the investigation, this method that I am using, tends to be inaccurate. The small increment method is very accurate in finding out the gradient of a tangent, and I will explain this method after this part of the investigation.
Next I am going to investigate to see what the gradient will be when the tangent is at x=-0.5. I am once again going to substitute the values into the equation.
.
The Change in Y = 1 = 3.3
The Change in X = 0.3
As you can see, this isn’t exactly the most accurate answer either. If you calculate it correctly, -0.5 x 6 = -3. As I explained previously, this method isn’t a very accurate method of finding the gradient. You can use the small increment method to make the answer more accurate. Below, I am going to use the small increment method to work out the gradient, when the tangent is at x=0.8. I will also explain what the small increment method is.
The small increment method is just another method to work out the gradient of a line. It’s a much more accurate way in finding out the gradient than the method that I have previously been using. To try and find a more accurate answer to the part of the investigation that I performed above, I will use this method now.
I am going to start by investigating the tangent at x=0.8. First of all, you must take the point on the graph of 0.8. To find the next point on the graph, you must multiply the tangent, by the place value of ‘a’. As we are investigating the curve of y=3x2, you must multiply 0.8 by 3. So the first set of co-ordinates will be (0.8, 1.92). To find the next set of co-ordinates is simple. You just have to make the points that you have just worked out a bit more accurate. This means that it will now be 0.81. Once again you have to multiply this by 3. This means that the second set of co-ordinates will be (0.81, 1.9683). You then simply substitute it into the equation that is used during the other method of discovering the gradient. However you must subtract the second set of co-ordinates from the first:
The Change in Y = 1.9632 – 1.92 = 0.0483 = 4.83
The Change in X = 0.81 – 0.8 = 0.01
As you can see, this is by far a much more accurate approach to finding out the gradient. The figure 4.83 is much closer to 4.8 instead of 5. I am now going to try and find a more accurate result, when the tangent is at -0.5.
Below is my ‘working out’ using the small increment method of x=-0.5:
-0.5 x 3 = -1.5 → (-0.5, -1.5)
-0.51 x 3 = -1.53 → (-0.51, -1.53)
The Change in Y = -1.53 - -1.5 = -0.03 = 3
The Change in X = -0.51 - -0.5 = -0.01
As it is a negative tangent, you now just need to add a negative sign to the answer. The gradient of the tangent at x=-0.5 is -3. If we work out the gradient, using the theory that the gradient function for the graph y=3x2, we can see that -0.5 x 6 is -3. This is an extremely accurate answer, as well as when the tangent is at x=0.8. As you can see from my work above, the small increment method is a much more accurate method of working out the gradient. This proves that the gradient function for the curve y=3x2, is 6x.
Now I have investigated three different graphs that have been squared, I am going to display my results of the gradient function of these curves in a table for convenience.
As you can see from my above prediction, it was correct – the pattern did continue. Every time I increased the value of ‘a’ from the equation by 1, the gradient function increased by 2x.
However by looking at my results this way, I have happened to spot another pattern. Every time that you increase the value of ‘a’ by 1, the gradient function will rise by two. For example, when y=1x2 (y=x2), the gradient function will equal 2x. When y=2x2, the gradient function will equal 4x. When y=3x2, the gradient function will equal 6x. This means that I can now write a general rule, about when you square ‘x’, and the gradient function.
Gradient Function = 2ax
GF = 2ax
As I have now investigated the graphs where x has been squared to discover y, I am now going to attempt to investigate what happens, when you cube x.
I am going to start simply investigating the graph of y=x3. As I have not yet investigated this graph, I don’t really know what is to come of it, therefore I cannot as of yet, predict what will happen. Below is a table of values for the curve.
Below I have once again used Omnigraph for Windows to create this curve.
As you can see, the curve is extremely different, to that of y=x2. Instead of the curve travelling in a downwards position from the upper left quadrant, and then returning to travelling in an upwards position in the upper right quadrant, the line travels upwards from the lower left quadrant, equals out on the x axis, and then travel upwards into the upper right quadrant. I think that this means, that the method that I was using in the previous set of curves will not work.
I have been studying my previous graphs of y=x2, and I have spotted a slight pattern. If you look at the curve between x=0, and x=1 on the curve of y=x3, and then compare it to the curve between x=0, and x=1 on the curve of y=x2, you can see that it looks extremely similar. I am now going to try and work out the gradient of when the tangent is at x=-1, by referring back to y=x2.
Firstly, as I am trying to find out the gradient, when the tangent is at x=-1, I am going to ‘square’ 1.
(-1)2 = 1
As I am also trying to work in the graph of y=x3, I am now going to multiply my answer, by 3.
1 x 3 = 3
I have now worked out the gradient of when the tangent is at x=-1, the gradient is 3. I have basically used the method, which I have stated below:
3 * x2
The ‘star’ in the equation, basically represents multiply. But as I already have an ‘x’ in the equation it would look to complicated to add another if it was not absolutely necessary. I am now going to try and work out the gradient, when the tangent is at x=1.5, using the same method as just before.
1.52 = 2.25
2.25 x 3 = 6.75
As you can see, the gradient when the tangent at x=1.5, equals 6.75. Now to see if I can prove the gradient function that I have worked out (GF=3*x2), I am going to look at the graph of y=2x3. Below is a table of values for that graph:
Below I have used Omnigraph for Windows, to illustrate this graph.
If you look closely at this graph, and the graph of y=x3, you can see that the curve runs through x=1, y=2, rather than x=1, y=1. This is because the equation is y=2x3. This means that in the final equation to work out the gradient, we simply have to multiply the answer we discover by two otherwise (obviously) the answer will be incorrect.
First of all, I am going to work out the gradient, when the tangent is at x=-0.75.
(-0.75)2 = 0.5625
0.5625 x 3 = 1.6875
1.6875 x 2 = 3.375
This means when the tangent is at x=-0.75, the gradient equals 3.375. Just to check that this is correct, I am now going to work out the gradient, when the tangent is at x=1.
12 = 1
1 x 3 = 3
3 x 2 = 6
If you compare the two graphs of y=x3 and y=2x3, then you can see a pattern with the curve. When it is only x in the curve, then the line will run through (1,1). When there is a 2x in the curve, the line will run through (1, 2). I am therefore going to make a prediction.
When I demonstrate the curve of y=3x3, I am going to predict that the curve will run through (1, 3). I am now going to demonstrate this curve using the same method as above.
Below is a table of values for the graph:
Below I have once again used Omnigraph for Windows to illustrate this graph:
As you can see from the table and the graph, my prediction was correct. I am now going to investigate when the tangent is at x=-0.7, using the method as I stated above the table of values.
(-0.7)2 = 0.49
0.49 x 3 = 1.47
1.47 x 3 = 4.41
I am now going to investigate when the tangent is at x=0.5.
0.52 = 0.25
0.25 x 3 = 0.75
0.75 x 3 = 2.25
As you can see from all of the information above for the graph of y=3x3, my prediction was correct. Every time that the place value of a is increased by one, then the curve on x=1, will always run through 1 higher place value of y. I have now put all my results for this set of graphs into a table, which you can find below:
As you can see from the table, I have spotted a pattern. This pattern I have underlined. To find the gradient, whatever the place value of 'a' is in the curve equation, you must multiply that by the sum of The Gradient Function equation.
I have discovered a general rule for this set of graphs. The general rule is:
Gradient Function = (3*x2) x a
GF = (3*x2) x a
I think that I may have spotted a pattern, but just to confirm that I have, I am now going to investigate y=x4. Below is a table of values for this graph:
Below I have used Omnigraph for Windows, to illustrate this curve:
As you can see from looking at this graph, it is sort of a cross between that of y=x2 and y=x3. It has a steep upwards, and downwards line, heading to and from the x axis, yet it has a flat part of the curve along the x axis when it reaches around 0. I am first of all going to investigate when the tangent is at x=1. I am going to use the same method that I used when I calculated the gradient on the graphs of y=x3. For that set of graphs, the gradient function was 3*x2. I am going to increase the 3, and the 2, to 4 and 3, hence making the gradient function 4*x3.
13 = 1
1 x 4 = 4
Now I am going to work out the gradient, when the tangent is at x=-1. I am going to predict that it will be -4.
(-1)3 = -1
-1 x 4 = -4
I am now going to investigate the graph of y=2x4, just to prove that the pattern that I think that I have spotted is correct. Below is a table of values for that graph:
Below using Omnigraph for Windows, I have illustrated this graph:
I am going to investigate when the tangent is at x=1. When the tangent is at x=-1, it will be the same, but negative instead of positive.
13 = 1
1 x 4 = 4
4 x 2 = 8
With the above information, I have proved that the Gradient Function for the set of graphs y=x4, is 4*x3.
Part 2
I have been asked investigate the Gradient Function, for any curve of my choice. I have decided that I am going to continue my investigation from the previous graphs, and then investigate further.
I have looked at all my results, and a graph that I have not covered yet. And I have noticed a pattern which I am going to insert into a table below:
I know that the Gradient Function for y=x is 1, because the line of y=x is a straight line. This means it goes through (0,0), (1,1), (2,2), (3,3) etc. This means that the Gradient Function is 1. For the graph of y=x2, I have converted the Gradient Function of 2x, to the same format as the other two sets of graphs that I have investigated. This means that I have changed the Gradient Function to 2*x1. ‘X’ is to the power of 1, as it is on its own in the equation.
From this data and the previous formulas, I can create a general rule for the Gradient Function, on any graph. This is:
nx(n-1)
I do not yet know if the same rule will work, when the place value of n is a negative number, however I am going to investigate that now. I am going to investigate the graph of y=x-1. Below is a table of values for this graph.
As you can see from this table of values, there is a break at when x=0. Using Omnigraph for Windows, I have illustrated this break at 0.
I am now going to work out the gradient, when the tangent is at x=1, x=2, x=3 and x=4, using the general rule that I calculated in the previous page which was nx(n-1).
TANGENT AT X=1: -1*(1-2) = -1
TANGENT AT X=2: -1*(2-2) = -0.25
TANGENT AT X=3: -1*(3-2) = -0.111111111
TANGENT AT X=4: -1*(4-2) = -0.0625
As you can see, this method does work. To be sure, I am going to check the method, when the equation for the curve is y=x-2. Below is a table of values for this equation.
Below I have used Omnigraph for Windows to illustrate this graph:
I am now going to work out the gradient when the tangent is at x=1, x=2, x=3, and x=4 using the general rule.
TANGENT AT X=1: -2*(1-3) = -2
TANGENT AT X=2: -2*(2-3) = -0.25
TANGENT AT X=3: -2*(3-3) = -0.074
TANGENT AT X=4: -2*(4-3) = -0.03125
As you can see, this formula does work. This means that the general rule that I calculated is correct. This means that I have concluded my investigation, by calculating a general rule to find the gradient function of any curve. This formula is:
GF = nx(n-1)
I am now going to investigate one more set of graphs. I am firstly going to compare the graphs of y=½x2, with the graph of y=x2. I draw tangents and find the gradients on y=½x2.
Below is a table of values for the equation y=½x2:
For the table of values for the curve y=x2, you can refer back to PAGE 1. As you can see if you compare them, the curve will be relatively similar. However (obviously) it will be a little different as the equation has changed.
Below I have used Omnigraph for Windows to illustrate the graph:
I am now going to investigate what the gradient will be, when the tangent is at x=2.5:
(0.5*2.5)1 = 1.25
1.25*2 = 2.5
As you can see, the gradient is exactly the same as the tangent. I am now going to investigate the gradient when the tangent is at x=-2.
(0.5*-2)1 = -1
-1*2 = -2
As you can see, the gradient is once again, exactly the same as the tangent. This means:
Gradient Function = Gradient
GF = G
I am now going to investigate the curve of y=½2x2. Below is a table of values for that graph. I am going to compare it with the graph of y=2x2, and you can find the table of values for that graph, on PAGE 3.
Below I have used Omnigraph for Windows to illustrate this curve:
Now I have illustrated this graph, I am going to work out the gradient when the tangent is at x=2.5, using the formula that I calculated as a general rule:
2*((0.5*2)*2.5)1 = 5
As you can see, the gradient is twice that of the tangent. I am now going to investigate when the tangent is at x=-2 to see if this will happen again – using the general rule:
2*((0.5*2)*-2)1 = -4
As you can see this has happened again. This means:
Gradient Function = 2*Tangent
GF=2T
As you can see from all the data in this investigation, the formula and general rule for calculating a gradient function for any curve, is:
nx(n-1)