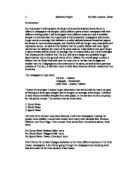
Investigation:
To investigate the area of the front page, the back page and the crossword page and how great a percentage is taken up by the following subjects:
- Headlines,
- Titles,
- Pictures,
- Text.
To show the data collected on each of the pages for each of the subjects I will first draw pie charts to show the percentage of each page taken up then I will draw bar charts showing the differences between the three newspapers.
The Front Page:
The following three pie charts came from the three chosen newspapers as stated above. These pie charts show the percentage of area taken up by the subjects.
Analysis:
These results show that the broadsheet had a greater percentage of its area covered by text than the tabloid or the quality paper, but it had the smallest area taken up by pictures and its headline. It had the same area of title as the quality paper but both had less area taken up than the tabloid.
Conclusion:
In conclusion the tabloid paper uses a greater percentage of its area for pictures than text unlike the broadsheet and the quality papers which both devote a greater percentage to the text on a page.
The Sports page:
The sports page has a greater percentage of its area taken up by pictures and headlines than the front page, this is proven by the above and the below results.
Analysis:
The above results show that the tabloid paper has the greatest percentage of it sports page taken up by pictures and that the broadsheet has the greatest percentage of text taking up the area of its page.
Conclusion:
In conclusion the sports page of the tabloid devotes a greater percentage to pictures again as the broadsheet and the quality papers both try to use a greater percentage of area to the story.
The Crossword Page:
Analysis:
The above results are the results of the investigation on the crossword page in each newspaper. The graphs show that the quality paper had the greatest are taken up by text and a greater area of headlines than the broadsheet paper.
Conclusion:
In conclusion for the crossword page of The Mail On Sunday has the greatest area devoted to the crossword and the broadsheet paper has a greater area devoted to the text on the age than any other newspaper.
Summary:
The bar charts show how each paper is different from each other and shows us how these two methods are the main methods for sampling this kind of data and representing it in the appropriate ways.
Mathematics Coursework 2002
Hypothesis Two:
The broadsheet paper will use more columns and pages for one particular story than the tabloid but the quality paper will use more pages and columns than both the broadsheet and the tabloid.
Investigation:
To investigate (using a scatter graph) one chosen story that all of the newspapers covered. This will show either a positive correlation between the three newspapers, a negative correlation or no correlation at all. The results are as follows:
To create this scatter graph I first made a table of the results from the three newspapers which looked like this:
Analysis:
In the graph and the table the results show that the papers do relate to each other and that the number of pages spent on one story is the almost the same but that is because of the size of the page as the broadsheet will have more room to spend on the story as the pages are bigger than the quality paper and the tabloid paper.
Conclusion:
The above table allowed me to make the scatter graph and to find that the three papers had some correlation. The correlation is high which shows us that the three papers even though some are smaller than the others still have a relationship with each other in the respect that they spend the same amount of time on the same story.
Mathematics Coursework 2002
Hypothesis Three:
The broadsheet paper will have more words per sentence in the first fifteen sentences than the tabloid and the quality paper. The quality paper will have more words per sentence than the tabloid.
Investigation:
To investigate the number of words per sentence for the first fifteen sentences on the front page. The data will be displayed in bar chart and box plot format.
Problems:
The may be one problem that could be encountered that is that the tabloid paper may not have fifteen sentences on its front page so the data that is going to be displayed will be the number of sentences available.