Maths coursework: hypotheses 1
The more time a person spends on their phone, the lower their IQ.
Using the data that I have been given, I will be investigating whether more time spent on a phone lowers a person’s IQ. I am going to do this because of recent reports I have heard on the news saying that using mobiles may possibly damage brain cells. I am going to try and prove this hypothesis by using Spearman’s rank correlation coefficient. I am going to use this mathematical technique because it is used to discover the strength of a link between two sets of data (in my case, call time per month and IQ).
The hypothesis tested is the more time a person spends on their phone, the lower their IQ should be.
The method of calculating the co efficient is:
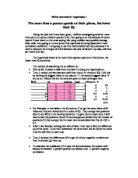
- First of all, I created a table from the data I’m doing my hypothesis on.
- Then, I ranked my two data sets (call time/ month in mins and IQ). I did this by ranking the biggest value in my column ‘1’, the second biggest value ‘2’ and so on. Values that are the same are given a mean (average) rank.
For Example, in this table in the IQ column, I’ve got the same value of 85 twice and they are ranked fourth in order of IQ. They occupy two positions (fourth and fifth) in the ranking hierarchy. To give them a mean rank, I will have to add the positions (4 and 5) they occupy and divide it by the number of positions (2) they occupy. So the mean rank is calculated like this (4+5)/2 = 4.5.
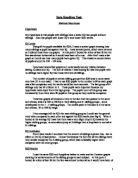
- After I had finished ranking both sets of data, I then had to find the difference (d) of the ranks. To do this I subtracted the ranks that I did for IQ by the ranks I did for call time on each row.
- Then, I squared the differences (d²) to get rid of any negative numbers and then I summed (∑) them up.
- To calculate the coefficient (r²) I used the formula below, the answer will always be between 1 (perfect positive correlation) and –1 (perfect negative correlation.