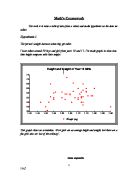
This is a graph showing the height and weight of both sexes.
We can see when they have been put together; the boys are slightly taller than the girls and most boys weigh more. This is what was expected, but this doesn’t show proof that when people get taller their weight rises.
Now I am going to do the same but with the year 11 pupils.
I don’t see any correlation yet. The year 10 and 11 girls are similar in their height and weight because they all seem to have an average height and weight.
For the first time we can recognize some positive correlation. It’s not much but we can see that most year 11 boys’ weight increases when they get taller.
This graph shows the weight and height of both sexes.
This shows that most boys weigh more than girls. This is expected but I still do not see evidence of my hypothesis.
Therefore my hypothesis that peoples’ weight increases when they get taller is not proven in the graphs.
The one time when we really see a positive correlation of this is on the year 11 boys’ graph, but one in four graphs is not enough.
Hypothesis 2
The higher the IQ, the better KS2 results.
I have taken 50 boys and girls from both years. This time I have put their data in a graph to show their IQ against their KS2 results.
We can see a positive correlation, in that when the exam results are higher their IQ increases. Now I will do the same for the boys and see if their graph is of a similar.
I can see positive correlation with the boys’ graph. We can also see from these two graphs that the boys seem to be more intelligent than the girls. So from the data of this year group, I have been able to create graphs that prove my hypothesis.
I will do the same for the year 11 pupils.
I can see some more positive correlation. The girls of this year also have a higher IQ than the girls in the year below.
This graph seems to be more mixed than the others, but still shows a positive correlation. Another thing that seems different about this graph is that there are more intelligent boys in year 10 and also the girls in this year are more intelligent as well.
My hypothesis that pupils with a higher IQ will have better KS2 results has been proven from the data. All four of the graphs I have produced showed this with a positive correlation, so this hypothesis has been proven unlike the first. .
Aaron sapsworth