Straightaway after the first two rows we see a pattern is developing which is that when the T-Number increases by 1 the T-total increases by +5.
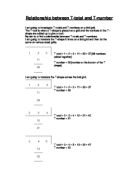
I will now look into developing a formula which can be used to determine the T-Totals for randomly placed T-Shapes on the same 9x9 grid.
Generalisation
If I was to find the T-Total for any T-shape on a 9x9 grid I would need a formula. Let n = the T-Number and t = the T-Total.
i.e.
In this case:
n = 77
t = 322 (58+59+60+68) +n
The T-Number minus each other number in the T-Shape looks like this:
77-58=19, 77-59=18, 77-60=17, 77-68=9
Below is another T-shape taken from the 9x9 grid.
56-37=19, 56-38=18, 56-39=17, 56-47=9
Notice that whatever the numbers are in the cells the differences from the T-Number are all equal to +19, +18, +17 and +9.
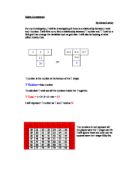
So to work out the T-Total, this simplifies to:
t = ((n-19) + (n-18) + (n-17) + (n-9) +n)
this simplifies to:
t = 5n-63 (5n being 5 x the T-Number) and (63 being the total of 19+18+17+9)
Testing the Formula
n= 50
t = 5n-63
t = (5x50)-63
t = 250-63
t = 187
To check if the formula is correct I will add the values the long way!
31+32+33+41+50 = 187 Correct
Testing My Hypothesis
I predicted that the T-Total would increase by 5 every time, going along the rows, one by one. This was to be true. However, to find the T-Total for any T-Shape I needed to use this formula:
t = ((n-19) + (n-18) + (n-17) + (n-9) +n)
to find a simpler formula which would work for all other T-Shapes on a 9x9 grid.
Extending the Problem
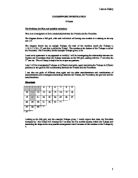
As mentioned previously I will now investigate further the relationship between the T-Shape and the position on other number grids. Once again I will start with the first row the second etc. to see if any patterns emerge.
Hypothesis
I believe that the T-Totals will still increase by +5, however, with the grid sizes being different I would expect the total to take away from 5n would be different as the position of the numbers on the grids will alter.
Results
6x6 Grid Row 1 (1-6)
Again the T-Totals increase by +5.
I will check again.
6x6 Grid Row3 (13-18)
I have jumped to Row 3 to prove my hypothesis was correct and it was.
So if my calculations of +5 are the same for a 9x9 grid and 6x6 grid it will be the same for an 8x8 grid and a 14x14 grid.
I will tabulate my results.
8x8 Grid Row 4 (25-32)
14x14 Grid; Row 9 (113-126)
My results confirm that with any number grid the T-Totals increase by +5.
Testing the Formula
With my results recorded on the table above for the 14x14 grid I will check my original formula to make sure this is correct.
n = 144
t = 5n-63
t = (5x144)-63
t = 720-63
t = 657 Incorrect
n = 152
t = 5n-63
t = (5x152)-63
t = 760-63
t = 697 Incorrect
This shows me that different sized number grids require a different formula as predicted in my hypothesis.
In this case:
n = 152
t = 662 (123+124+125+138) +n
152-123=29, 152-124=28, 152-125=27, 152-138=14
So to work out the T-Total, this simplifies to:
t = ((n-29) + (n-28) + (n-27) + (n-14) +n)
this simplifies to:
t = 5n-98 (98 being the total of 29+28+27+14)
The formula is dependent on the size of the grid.
On a 9x9 grid the formula is t = 5n-63 63 is equal to 7x9
On a 14x14 grid the formula is t = 5n-98 98 is equal to 7x14
So on a 6x6 grid would the formula be: t = ((5n-(7x6))
Results
I will work this out using the table previously shown:
n = 29
t = ((5n-(7x6))
t = 5n-42
t = (5x29)-42
t = 145-42
t = 103 Correct
I will let g = number grid size
E.g. an 8x8 grid would be:
g = 8
So the formula will now be:
t = 5n-7g
I have an 8x8 grid, what is the T-Total if the T-Number is 46?
n = 46
t = 5n-7g
t = (5x46)-(7x8)
t = 230-56
t = 174 Correct
See below an excerpt taken from my results from the 8x8 grid, see page 7.
Table of Results
*Please note that the smallest grid size will be 3x3.
The formula is the same for all grid sizes.
Below I have provided a fully justifiable conclusion to my solution:
7x7 Grid
n = 40
g = 7
t = 5n-7g
t = (5x40)-(7x7)
t = 200-49
t = 151
25+26+27+33+40=151 Correct
Extensions
I will now investigate other transformations and combinations on different number grids and investigate further the relationships between them.
I will start by using the T-Shape below on a 9x9 grid.
* = The T-Number
Results
9x9 Grid
Again the T-Totals increase by +5.
Testing the Formula
Would my previous formula work?
n = 14
g = 9
t = 5n-7g
t = (5x14)-(7x9)
t = 70-63
t = 7 No the correct answer is 77
Because:
t = ((n-7) + (n+1) + (n+2) + (n+11) +n)
The T-Number is not the highest number in the T-Shape.
t = 5n+7
t = (5x14) +7
t = 70+7
t = 77 Correct
n = 15
t = 5n+7
t = (5x15) +7
t = 75+7
t = 82 Correct
n = 47
t = 5n+7
t = (5x47) +7
t = 235+7
t = 242
40+47+48+49+58=242 Correct
t = ((n+9) + (n+17) + (n+18) + (n+19) +n)
9+17+18+19=63
n = 39
t = 5n+7g
t = (5x39) + (7x9)
t = 195+63
t = 258
39+48+56+57+58=258
t = ((n-11) + (n-2) + (n-1) + (n+7) +n)
-11+-2+-1+7=-7
n = 49
t = 5n-7
t = (5x49)-7
t = 245-7
t = 238
38+47+48+49+56=238 Correct
Table of Results for all Transformations
Summarising Results so far
For each T-shape to translate 90° the formula depends on the position of the T-Number, if the T-Number is the highest number in the T-shape then it will be -7 as the other numbers in the T-shape will be lower. If the T-Number is the lowest number in the T-shape then it will be +7 as the other numbers are higher.
With a 90°clockwise transformation of an upright T the T-Number is neither the lowest nor the highest, but the highest number minus the T-Number is equal to 7.
With a 270° clockwise transformation, the T-Number is, again, neither the highest nor the lowest number but the T-Number minus the lowest number is equal to 7.
Justifying the Formula
Question
I need to find out the T-Total for a 270° T-Shape who’s T-Number is 55 on an 11x11 grid.
Answer
n=45
t=5n+7
t= (5x45) +7
t=225+7
t=232
Check
Conclusion
I have found that each different translation requires a formula similar to each other translation for different sized grids.
I believe I have fully justified the explanation of this occurrence by checking my findings and tabulating results.
My initial hypothesis was correct stating that each T-Shape would increase by 5 thus finding the relationship between the T-Number and T-Total was +5 for any translation on any sized grid.
Further Extensions
If I had time I could explore the relationship between different sized T-Shapes on different sized grids, for example, extended T-Shapes (5 on the top row and 3 on the bottom row etc.) and elongated T-shapes.