Mean: 8.3
Median: 8.5
Mode:/
Boys
Mean: 8.3
Median: 3
Mode: 2
Girls
Boys
Histogram of the Height of Boys and Girls
I can see that in general a total of 20 girls’ height lies between 1.61 and 1.70m. A wide variation of girls’ heights, a constant upward gradient of weight but then a constant lowering again.
Most of the boys’ height lies between 1. 61 – 1.70m, same as the girls’ height and not many boys are taller than 1.70, only 12.
A clear difference shows there are 2 boys whose height lies between 1.91 and 2.00m, whereas none of the girls’ height lies between those numbers.
Interquartile Range: 20 cm
upper quartile: 1.61
lower quartile: 1.41
Cumulative Frequency Curve of the Boys’ and Girls’ Height
But once again its quite clear that there are some boys that are clearly taller than girls.
Scatter Diagram Girls Weight and Height
On this diagram I can see that if the height increases the weight increases as well, although the correlation is only 0.25. This is not shown very clearly on my diagram, which does not really support my prediction, as you grow taller, your weight increases.
On this graph there might be an anomalous result. Height: 1.80 and Weight: 110 kg.
In my opinion this actually could be possible, so I will not regard this result as an anonymous.
Scatter Diagram of Boys’ Weight and Height
Also on this Scatter diagram of the boys, it’s clear again that if you grow taller, your weight increases.
The correlation this time is 0.55. It’s higher than the correlation of the girls’ height, which might tell that the heights and weights of girls are very different.
On my scatter graph I can see an anomalous result. Height: 1.67m, Weight: 6 kg.
This is an anonymous result that was in the spreadsheet. Some mistake or error probably occurred and the data was changed/ manipulated.
However, a correlation of 0.55 supports my prediction, that if you grow taller, your weight will increase.
Year 7 girls
Year 7 boys
Height of boys and girls in year 7
On this histogram I can clearly see that my prediction was correct.
“Girls in year 7 are more likely to be taller than boys in year 7”
Although there are some girls whose height lies between 1.40 and 1.60, there are many girls whose height lies between 1.70 and 1.80.
There are very few boys whose height lies between 1.70 and 1.80 and most of the boys’ height lies between 1.50 and 1.70.
This shows me that the girls in year 7 are taller than the boys in year 7 and this graph proves my prediction to be correct.
This is probably because growth spurt takes place earlier with girls than with boys.
Year 11 girls
Year 11 boys
Height of boys and girls in year 11
Once again, my prediction proves to be correct, “Boys in year 11 are more likely to be taller than girls in year 11”.
On this graph the boys’ weight is more distributed than the girls’ weight and there are some boys whose height lies between 1.90 and 2.00 metres.
The total girls’ weight only lies between 1.50 and 1.80, whereas the total boys’ weight lies between 1.30 and 2.00 metres.
These two graphs support my prediction.
It shows that in year 7 girls are still taller than boys, but in year 11 the boys are taller than the girls.
This is probably because growth spurt takes place earlier with girls than with boys, but after a certain period of time, the boys start to grow and mostly they catch up with the girls.
Key Stage 3 Heights of boys and girls
Key Stage 4 Heights of boys and girls
Comparing those two graphs, I can see some clear differences. Although, it’s a little confusing when looking at it for the first time, there is enough evidence to support my prediction.
“As students get older, their height will increase as well“
I made two graphs, one of the height of boys and girls of Key Stage 3 and one of the height of boys and girls of Key Stage 4.
Looking at the graph of key stage 3, I see that there is not much variety in heights, since all the boys’ as well as girls’ height lies between 1.30 and 1.80 metres. The tallest students on this graph are the Y7 boys, year 8 boys and girls and year 9 boys. Most of the students height lies between 1.50 and 1.60 metres, where the year 9 boys are the majority.
Looking at the Key Stage 4 graph, the weights are more distributed and the heights lie between 1.30 and 2.00 metres, which is a clear difference to the height of Key Stage 3. Also the majority of the heights lie between 1.60 and 1.70 metres, whereas the majority of the height for Key Stage 3 lies between 1.50 and 1.60.
The tallest boys in this group are the year 11 boys, which are in the highest class, so therefore they’ll be the oldest.
This proves that my prediction was correct, since the tallest students are in the higher years, which means they’re older.
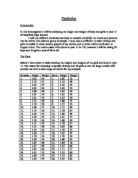
Grouped Data for all year Groups
Number = Frequency
This table shows a pattern. As the age increases, the height increases as well. This supports my prediction, as students get older, their height increases.
A line of best fit can be added, that shows a downward gradient.
Also this table shows a pattern that is more clear than the other table’s pattern.
Students’ weight increases as they get older. This is shown by the distributed frequencies of the boys in year 11.
Also here I can draw a line of best fit on this table, which will show a downward gradient as well.
Conclusion
Here is an overview of the results I have obtained, related to my hypotheses:
“Tall students weigh more than short students.
As people grow taller, their weight will increase. “
This is true, as it can be seen one my histograms and also on my tables of the grouped data for all the year groups.
“Girls in year 7 are more likely to be taller than boys in year 7”
This statement is also true, which is proved on my histogram, where boys height of year 7 is compared to the girls height of year 7.
This is because the growth spurt of the girls takes place in the earlier stages of life as the growth spurt of the boys, who catch a few years later only.
“boys in year 11 are more likely to be taller than in girls in year 11”
This statement is true as well, as seen on my graph, where I compare the boys height of year 11 to the girls height of year 11. I can see clearly that the boys caught up with height over the years, as I predicted. This is once again because of the growth spurt, that takes place in the later stages of life with boys.
“As students get older, their height will increase as well.”
This is also proved on my histograms, comparing the heights of students of Key Stage 3 to the heights of students of Key Stage 4.
All in all, I think that all of my predictions have proved to be correct and I’m quite happy with my results.
Appendix
Random Collection
Here is a list of my random collections: