-
A 0.25m2 quadrat, in this quadrat I will be sampling the topshell population.
- A key to identify monodonta lineata from other gastropods.
- A random number sheet, this will give me random cordinates to sample from and eliminate any bias on my part on selecting where to sample.
- A collecting tray so I can easily count the population of topshells in my quadrat.
Method:
- When I get down to the beach I will first locate my sheltered and exposed areas marking out a 10m by 10m area at each site making sure that these sites are the same vertical height from the water. I think a 2 metre vertical height will be ok. 10m by 10m is a very large area to sample from so I’m confident that I will be able to get a suitable amount of quadrats in that area to get good representative data.
- I will then use a random number sheet to generate fifteen cordinates. The advantage of using a random number sheet is that it will eliminate any bias be I when picking the cordinates. Also my using so many cordinates I’m giving myself a large area from which to sample.
- At each cordinate I will use my 50cm by 50cm quadrat to sample the number of topshells in that quadrat. By using a 50cm by 50cm quadrat I’m giving myself a large area in which to count topshells and because of the large amount of quadrats used I will gain reliable data.
- I will record my data in a tally chart like this one:
Data Analysis:
To analyse my data I will be using the chi2 test. The chi2 test is best used when collecting raw frequency data. By using this test I will be able to show whether my results support my hypothesis or nul-hypothesis. This test involves an equation:
X2=∑(o-E)2
E
X2= chi2
O= observed population
E= expected population
I will calculate the result in a chi2 table this is an easy way to calculate chi2. It will make sure that my calculations are accurate.
Risk assessment:
When conducting this infield experiment it is important to be safe. So we must consider safety points.
The path to the beech is very steep and I will be carrying a lot of equipment so I must be very careful not to slip because it could lead to serious injury.
Also because I’m working on different sides of the beach I must make sure that I have enough time to sample at both sites before the tide cuts them off because I could get trapped on one side of the beach.
Variables:
Skill B-Implementing:
Modifications:
After writing my plan I decided to make some modifications. These modifications made my experiment more accurate and allowed me to record very accurate results.
To ensure that the data collected was accurate I used various methods. When measuring the amount of monodonta lineata in each quadrat I made sure that all the monodonta lineata were collected and counted properly by double checking each time. I also made sure that the quadrat was carefully placed at the exact cordinates. By using a random number table I ensured that there was no bias in the choosing of the cordinates.
Skill C-analysing:
Chi squared test:
The number of topshells that were observed in two different environments were as follows:
Sheltered = 395
Exposed = 181
The nul hypothesis being tested is that there should be no difference between the amount of monodonta lineata in each area.
For a result to be significant there must be less than a 5% probability (P < 0.05) that the result was due to chance. By comparing the calculated chi squared value with the critical value, the significance can be determined.
As there are two categories, the number of degrees of freedom is two minus one, which equals one. So if I use a table of chi2 at P=0.05 and one degree of freedom, the table value for chi-squared is 3.84.
Since the calculated value of chi2 is 79.5, there is a significant difference between the observed and expected values, and the nul hypothesis has been rejected.
Population of topshells in each area:
For a good representation of the data I had to work out an estimation of the population of topshells in each area. To work out the population first I had to work out an average number of topshells in each quadrat.
Average number of topshells in the sheltered area:
395 ÷ 20 = 19.75.
Average number of topshells in the exposed area:
181 ÷ 20 = 9.05
Then I had to work out how many quadrats went into the each sample area.
0.25m2 = area of quadrat
100m2 = area of sample area
100 ÷ 0.25 = 400
Then I had to multiply the average by the number of quadrats that could have fitted into the sample areas.
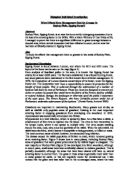
Sheltered: 19.75 × 400 = 7900
Exposed: 9.05 x 400 = 3620
To show this data I have used a bar graph it shows that the estimated population in the sheltered area is larger than the estimated population in the exposed area and therefore proving my hypothesis.
Conclusion:
From my results I can conclude that the sheltered area at saltern cove has a larger population of the monodonta lineata than the exposed area.
This is because the abiotic factors are harsher at the exposed site than the sheltered site.
At the exposed site there are a number of factors that make it harder to live than the sheltered site.
That area of saltern cove, where the exposed site is, is regularly subjected to large waves this could affect the monodonta lineata in many different ways. If the waves are large enough they could just simply wash away the larger monodonta lineata causing them to die, as they would have no feeding grounds. Meaning they would have a shorter life span compared to the monodonta lineata at the sheltered site because as soon as they reached a certain size they would be simply washed away. Waves could also lead to a reduction in the quantity of food because the constant movement of the water wouldn’t allow the algae to settle on the rocks like a normal tide would. This means that the monodonta lineata could not just graze on the rocks meaning that the food resources where decreased which would increase intraspecific competition meaning there could possibly be a decrease in population. I also noticed a difference in the type of substrate that was in the exposed sample area. The area had many large rock formations that were high up meaning that the monodonta lineata would have to live at a higher altitude. Which would mean that the tide took longer to cover them and they spent less time under the water this would have a large effect on the type of environment that the monodonta lineata would have to live in. If the tide took longer to cover them it would increase the time they spent out of the water which would have an effect on the amount of water they could retain within their shell. If they spent to long out of the water they would be prone to desertifictaion where they would lose a lot of their water to the environment via osmosis then the organism would be unable to carry out a lot of the biochemical reactions needed to survive. So the monodonta lineata could die of dehydration.
Also if the tide only covered these rocks for a short time the amount of algae that could settle on these rocks would be greatly reduced. This would lead to a decrease in food source so the monodonta lineata would die of starvation. There was also a small area made of sand, which the monodonta lineata could not feed on. The biodiversity in gastropods in the exposed area was much greater than the sheltered area; I noticed many more species like the dogwhelk and mussel in this area, which would lead to increased interspecific competition and predation. All these factors make the exposed area of saltern cove a much harder area for the monodonta lineata to live.
The sheltered area had less harsh abiotic factors meaning it would have been much easier for the monodonta lineata to live. Like the area was protected from large waves meaning much more topshells could live there and they could grow to a bigger size meaning they would have reproduced more and had more offspring and therefore increasing the population size.
Usually in calm water environments you would expect large fucus seaweed’s to grow, which would cover the rocks and prevent them from being covered in algae which would lead to a decrease in food and therefore the monodonta lineata population would decrease. But at this sample area the substrate is different. The rocks at this site were small meaning that the bottom was constantly moving so no seaweed could attach itself to the rocks and therefore algae could settle on these rocks and monodonta lineata could feed and would provide a stable ecosystem in which they could live and reproduce. Also these small rocks could protect them from being eaten predators by letting the topshells hide under them. All these abiotic factors suit the monodonta lineata so naturally there would be a large population.
Skill D-evaluating
I think that the results I obtained from my experiment were fairly accurate as they did show the outcome I had predicted in my plan but in any experiment there were limitations.
When placing my quadrat it wasn’t an even surface so I had to roughly guess where the edge of the quadrat was. This could have effected my results by allowing me to count or miss some monodonta lineata that were or weren’t really in the quadrated area. Which could in turn cause minor differences in my calculated X2 value But I don’t think it would have effected my conclusion very much as the error was not that big. Also at the exposed area there were large rock formations so some parts of this sample area could have been higher than the sheltered area. This would have effected my result and conclusion because the monodonta lineata at that height could have been more susceptible to being eaten by predators because they are higher up and so more visible to some predators or dehydrated because it would have taken longer for the tide to cover them. This would have affected my conclusion because the samples taken at that height would have been a decreased amount of monodonta lineata but because the rock formation was natural I must accept the data as it is and can’t make any assumptions on the amount that the monodonta lineata population could have decreased by.
I did get a few anomalous results at the exposed area, at cordinates (8,2), (1,0) and (0,1). I think these were anomalous because at these cordinates there were the harsher abiotic factors. At the (1,0) and (0,1) cordinates, were the substrate was sand which would make it impossible for any algae to settle due to the constant movement of sand particles. This would inhibit the monodonta lineata from grazing their natural food source and therefore forcing them out of this area, as they could not survive. At (8,2) cordinates, the sample area was at it’s highest this meant that it was the area covered the least amount of time by the tide. This would decrease the amount of time that the algae had to settle on the rocks and therefore decreasing the amount of available food which could in turn lead to a population decrease.
One major limitation is the fact that monodonta lineata are always on the move; they never stay in one place for too long so you can never be quite certain that the results that you obtained are that accurate. For example a large amount of topshells could have migrated out of the exposed area on the day that I took my samples. Which would have cause my results to be slightly biased in the way that the exposed area would be less populated because of mass migration instead of the harsher abiotic factors. So I use a 5% probability of a chance result to be considered in my statistical test. This allows the possibility of mass migration or the effect of other factors beyond my control to be considered when doing my statistical test.
Another limitation is the fact that I must make assumptions when conducting my experiment. Assumptions such as, that there will be no mass migration, mass predation and mass deaths or births. All these scenarios are a possibility however unlikely they could be so I must consider them when writing my conclusion.
With the resources at my disposal I think my experiment was very accurate and gave a reliable interpretation of these results but if I had greater resources and time I could have made my experiment more accurate. By expanding the sample area to encompass the whole of the sheltered and exposed areas and doing lots more samples the data that I would have collected would have been very accurate. If I had a lot more time I could have done sampling over many different days in summer and winter this would have given me reliable population data and I could have measured the population fluctuations between seasons.
Bibliography:
http://www.wikipedia.org/