Aim
I will investigate the relationship between the height a raised to on a ramp and the speed of it at the bottom of the ramp.
Apparatus
Metre Rule- this will be used to measure the length of the ramp and the height from which the trolley is released.
Trolley- this is what we will be investigating the behaviour of. We will raise it to a certain height on the ramp and then release. We will then measure the speed of it at the bottom.
Ramp- this is really a long, straight plank of wood. The trolley will travel along this.
Jack- this is the device which will be used to raise the ramp to certain heights.
Light gate- this will be used to measure the speed of the trolley at the bottom of the ramp. It measures the speed in m/s to 3 decimal places.
Diagram
Method
The apparatus will be set up as above. The jack will be used to raise the ramp to a certain height. The height of the start position of the trolley will be measured and then the height of the end position of the trolley would be measured using metre rulers and the difference of these two measurements would give the height, h. The light gate would also be connected to the QED and positioned at the end position of the trolley. The trolley would be raised to the top of the ramp. It will then be released down the ramp without any human force pushing it down. The light gate would measure the time interval for the trolley to pass through the light gate at the bottom of the ramp. For each height the time interval for the trolley to pass through the light gate will be measured 3 times. This will then be repeated with a number of different heights.
Measuring Variables
Height of ramp- this will be measured using a ruler. Each height will be measured to the nearest millimetre.
Time Interval of trolley- this will be measured using a light gate as opposed to a ticker timer or by using a stopwatch because it is much more hi-tech and effective and also takes out the factor of human error from the results. It measures the speed in seconds to 3 decimal places.
Precautions
For each height, 3 different speed measurements will be taken and then the average would be calculated. This would make the results more reliable because it is easy to isolate any anomalies. This would also ensure that the results are reliable because we are reproducing similar results.
Each height will be measured to the nearest mm using the metre rule. It would be measured three different times just to check that it is at the correct height.
Prediction
I predict that as the height increases so will the speed of the trolley.
When released from the top of the trolley, gravitational potential energy transfers to kinetic energy. Assuming that no energy is lost by friction:
This rearranges to:
The force, g, is always constant and h is the independent variable and v² is the dependent variable.
Therefore h will be directly proportional to v² and a results graph will show a straight line through the origin.
According to the equation these would be the values obtained for the v² and this is what the results graph would look like.
Preliminary Work
From experimenting with the equipment we found many different things whish could be amended in the method.
The jack and the ramp would have to be adhered to the work surface. This would stop them from moving which would change measurements slightly and make the results slightly inaccurate.
The distance travelled by the trolley will be one metre because that is the simplest figure that could be used with the ramp.
The heights that will be used will be 0.04m, 0.06m, 0.08m, 0.10m, 0.15m, 0.20m and 0.25m because they are simple numbers and these are the heights that can be measured safely. The lowest is 0.04m because when the height is 0.02m the trolley stops moving before it reaches the light gate. The highest is 0.25m because that is the highest height achievable by using one jack. We will use 7 different heights for our results to be reliable because 5 is too few data points to be able to plot an accurate results graph.
The trolley will be released as opposed to pushed down the ramp so that its speed is neither increased nor decreased.
We will use the light gate to measure the time taken for the trolley to travel 10 cm at the end of the runway as opposed to measuring the speed.
We tried out the method with random values to see if the results were reproducible and reliable and they were.
Amended Method
The apparatus will be set up as above. The jack will be used to raise the ramp to a certain height. The height of the start position of the trolley will be measured and then the height of the end position of the trolley would be measured using metre rulers and the difference of these two measurements would give the height, h. The jack will then be extended or contracted in order to get the specific heights for h (0.04m, 0.06m, 0.08m, 0.10m, 0.15m, 0.20m, 0.25m).The light gate would be connected to the QED and positioned at the end position of the trolley. The trolley would be raised to the top of the ramp. It will then be released down the ramp without any human force pushing it down. The light gate would measure the time interval for the trolley to pass through the light gate at the bottom of the ramp. For each height the time interval for the trolley to pass through the light gate will be measured 3 times. This will then be repeated for all of the different heights.
Analysis
As the height of the ramp increased, so did the velocity.
The line of best fit on the graph is an exponential curve. This means that the velocity increases until it gets to a certain height when all of the velocities higher than that will be the same.
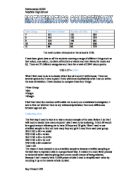
I squared the results for v to get the results for v². These are the results for that.
I predicted that height would be directly proportional to v². By using the equation: v²=2gh, I got these predicted results.
The graph below shows the results I got against my earlier prediction.
The blue line shows the actual results I got and the pink line shows my prediction. My prediction was that v² and height would be directly proportional. The line of best fit would pass through the origin. My results show the line of best fit passing below the origin. This means that the v² results which I got were slightly below what was expected.
This is because there was friction between the wheels of the trolley and the surface of the ramp. Also energy may have been lost by friction in the axels of the trolley.
I calculated the efficiency by dividing the result that I got for a particular height by what the result should have been according to the equation: v²=2gh and then multiplied the answer by 100 to get the efficiency in %.
As you can see, the efficiency increases as the height of the ramp increases.
Why?
The first diagram shows a very horizontal ramp. This would mean that its weight is going directly into the ramp. This would mean that there is more friction and therefore there is more energy lost in the transfer between gravitational potential energy and kinetic energy. This energy would be lost as heat.
The second diagram shows a vertical runway. In this case, none of the weight is going though the ramp and therefore there is no friction between the trolley and the ramp. The third diagram shows a diagonal ramp. More weight would be going through the ramp than in the second diagram but less than in the first diagram, which means that the loss of energy would be somewhere in between the energy loss in the first two diagrams.
As the height increases, so does the angle. So as the angle increases, less energy is lost as friction.
Evaluation
Our experiment was fairly successful even though our results did not match the prediction. The measurement of the height may have been difficult because we could only measure to the nearest mm.
There is no anomalous data as such, but on the most of the results graphs, you can see a distinct pattern. For the data points for the heights, 0.04m, 0.06m and 0.08 you can see a totally different line of best fit to the line of best fit of the other 4 data points. This skewed the results slightly.
The reason that there are two lines of best fit is that the results were taken on two separate occasions and two different trolleys were used. Each trolley would have a certain amount of grip on the wheels (causing friction between the wheels and the surface of the ramp) and a certain amount of friction in the axels. This would mean that they would lose different amounts of energy in the energy transfer and therefore would travel at different speeds.
If I could redo the experiment I would improve it by:
- Using one trolley throughout the entire experiment in order to obtain a more consistent set of results.
- By creating an environment in which there would be no friction. This could be done by using an air track instead of a wheeled trolley and a ramp. There would be little or no friction between the track and the trolley.
- Although it is not possible with the resources available to me, I could perform the experiment in a vacuum to take away the effect of air resistance on the trolley.
An additional experiment to confirm my results would be to measure the speed using the light gate instead of measuring time. This would also eliminate the possibility of an error when measuring the length of the runway.
I think that even though two trolleys were used, the results are still fairly reliable. If you define anomalous data as pieces of data more than 10% away from the line of best fit, there is no anomalous data.