Siphon out a little water and hold the mouth of the tube with a finger to hold the water in. Now note the initial height of the water column, h0. Start the stopwatch simultaneously when the water starts running. At a convenient time intervals stop the flow with your finger and note down the time and the height of the water column. Continue until the jar is emptied.
Do all the following plots by hand as well as by computer.
Plot a graph of h versus t with all the appropriate error bars. Determine the time at which the height has reached ½h0 and call this T½.
Plot the graph of ln(h) versus t and obtain a value for the constant k in Eq. 2 above.
Determine the theoretical relationship between k and T½ and compare this with your experimental result.
DATA COLLECTION
The data is the change in the height of the water column in the jar within a fixed time interval of 10 secs.
(Table 1.1)
DATA PROCESSING AND PRESENTATION
The Graph of height of water column against time.
(Table 1.2) (Graph 1.1)
Interpretation
The table 1.2 gives the difference in the heights of successive readings. We can see that there is a decrease in the difference in the height of the successive readings.
It is also illustrated by the graph 1.1 which is an inverse exponential curve. Thus, rate of change of height of the water column decreases with respect to a fixed time interval i.e. 10 secs.
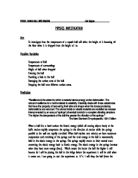
The Graph of ln(h) against time.
(Graph 1.2)
(Table 1.2)
Interpretation
The slope of the graph gives us the constant k i.e. m in the graph. And m = - 0.018 cms/ sec ± 0.00102 cms/sec. And ln(h0) = 4.28 cms i.e. given by b in the graph, which is the y intercept of the graph. The values of ln(h0), given by the y intercept of the graph and the ln(h) of the initial height 41.6 cms, which we get ln(41.6) = 3.7821cms.
Note: While trying to find the correct graph fit, I found that the Inverse Exponential function was the best fit for the graph, which suggests a relation of the graph to Eq. 1 i.e. h(t) = h0 ∙ e – k t .
The theoretical relationship between k and T½.
ln(h) = ln(h0) – k t (Eq. 2)
in this case h = ½h0
ln(½h0) = ln(h0) – kt
ln(h0) – ln(2) = ln(h0) – kt
ln(2) = kt
t = ln(2)/ k
and let t = T½
CONCLUSION
I didn’t obtain a log linear relationship as stated in the lab sheet since we can see from the results I got from the graphs.
But there is a log linear relationship existing.
Evaluation
In Graph 1.2 the value for the time at which the height has reached half of the initial height i.e. ½h0 which is theoretically equal to 20.8 cm but in my graph the value I can get closest to is 21.1 cm. This is quite accurate to the theoretical value. And the time is 70 seconds which is 70/270 roughly ¼ of the time taken to drain out all the water in the jar.
There were some errors due may be while starting and stopping the watch. This error cannot be eliminated.