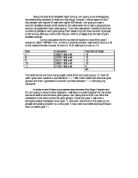
I will now find the averages for IQ and KS2 for each year then the entire school.
Averages… IQ…
To get the average IQ I added up all the IQ’s in the certain year and then divided the total by the number of students in my sample in that year.
Year 7 = 1416 / 14 = 101.1
Year 8 = 1416 / 14 = 101.1
Year 9 = 1291 / 13 = 99.3
Year 10 = 1004 / 10 = 100.4
Year 11 = 930 / 9 = 103.3
All years = 6057 / 60 = 100.95
This is the average IQ for the entire school.
Average KS2
I got the average Key Stage 2 results by adding up each students key stage 2 results then divided each students total KS2 results by 3, this enabled me to find the average of each child. To get the year average I added up all the children’s average KS2 results then divided it by the number of students in the year’s sample.
Year 7 = 58.2 / 14 = 4.15
Year 8 = 58 / 14 = 4.14
Year 9 = 49.9 / 13 = 3.83
Year 10 = 39.1 / 10 = 3.91
Year 11 = 36.8 / 10 = 3.68
All years = 24.2 / 60 = 4.03
These results are quite interesting, as the year’s progress it seems people are getting higher key stage 2 results. This could be due to many influential factors: the method in which the teachers teach their students may have improved. Another factor could be that the parents encourage their children to study more at home, so this in turn will help the students improve their grades.
Analysis of Scatter Diagrams…
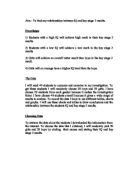
After completing my year 7 scatter diagram I have noticed that there is a strong positive correlation. My line of best fit shows this. I have drawn a line of best fit so that I will be able to predict someone’s IQ level from his or her average Key Stage 2 results and vice-versa. Most the points were close to the line apart from 2 odd points; one of the points is quite far below the line of best fit, while the other is very far above the line of best fit.
In Year 8 the same sort of trend followed from year 7 but there was not as a strong correlation as before. This could be due to my hypothesis, which I made earlier.
In year 9 the trend continued but there was one extreme point, which was very far away from the line of best fit. This was the only extreme point but there were other points, which were quite far away from the line of best fit. 5 points all resided on the same x-axis, which was 4. So that must mean that quite a number of people got a key stage 2 average of 4
In year 10 the trend stayed the same but the points were not as closely packed, as before, there was gaps between them. The majority of the points resided higher on the line of best fit only 3 points were below an average key stage 2 result of 4.
In year 11 there were no unusual points, all the points stayed close to the line of best fit.
After looking at my statistics it is clear that there is a slight relationship to the IQ and Key Stage 2 results. This does not mean that body with the same IQ got the same key stage 2 results or vice versa. Using my lines of best fit I am able to predict the IQ of a person with the average key stage 2 result of 4.6. I obtained the following results:
It appears that pupils have the highest IQ in year 11 and 10; years 8 and 9 have the lowest IQ out of the entire sample. My hypothesis does not show what is in the table; it is the complete opposite in fact.
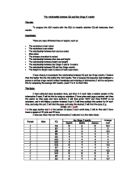
I am now going to calculate the average IQ results and the average key stage 2 results, median class and value, mode and modal class and also the range of my sample. I will do this for my whole sample and then for each separate year group as I have been doing previously. I am doing this so that I can gain more informative statistics and use them to explain any relationships between key stage 2 results and IQ results.
To find out the mean KS2 result I will have to add all the mean KS2 results for every student then divide it by the number of students within in that year or sample. E.g. 57.9/14= 4.14 (2dp)
KS 2 Results
Mean
Year 7: 57.9/14=4.14 (2dp)
Year 8: 58.7/14=4.19 (2dp)
Year 9: 49.9/13= 3.84 (2dp)
Year 10: 39.1/10= 3.91 (2dp)
Year 11: 37/9= 4.11' (2dp)
Whole: 242.9/60= 4.05 (2dp)
Median
Year 7: 4.3
Year 8: 4.15
Year 9: 4
Year 10: 4
Year 11: 4.3
Whole: 4
Mode
Year 7: There are 3 modal values 4, 4.3, 4.6
Year 8: 4
Year 9: 4
Year 10: There are 2 modal classes 4 and 4.3
Year 11: 4.3
Whole: 4
Range
Year 7: 2.7
Year 8: 2.3
Year 9: 3
Year 10: 1.3
Year 11: 1.3
Whole: 3.3
IQ
Mean
Year 7: 1416/14= 101.14 (2dp)
Year 8: 1416/14= 101.14 (2dp)
Year 9: 1291/13= 99.3 (2dp)
Year 10: 1003/10= 100.3 (2dp)
Year 11: 831/9= 92.33' (2dp)
Whole: 6056/60= 100.93 (2dp)
Median
Year 7: 102
Year 8: 101
Year 9: 101
Year 10: 102
Year 11: 103
Whole: 102
Mode
Year 7: 100
Year 8: There are 3 modal values 100, 101, 104
Year 9: 103
Year 10: 102
Year 11: 110
Whole: There are 2 modal values 100 and 103
Range
Year 7: 52
Year 8: 28
Year 9: 48
Year 10: 22
Year 11: 18
Whole: 55
The table above shows that year 11 IQ is the smallest in the table, this backs my hypothesis, which I stated earlier. Year 11 have the highest IQ median in the table, year 8 had the highest average KS 2 results in the table. Year 9 and 10 KS 2 data is the smallest within the table.
I am now going to draw cumulative frequency diagrams for my data, as with previous actions I will do a diagram for the entire sample and also for each year. In doing this I hope to see more clearly the spread of the data about the median value. This will show any odd pieces of data I may have in my example. It will show where 50% of my data lies about the median, therefore examining further the relationship between the IQ levels and average key stage 2 results.
Cumulative Frequency…
Year 7
Year 8
Year 9
Year 10
Year 11
Summary of cumulative frequency results for IQ
The table shows that most of the data from the year 7 and 8 lies within a larger spread of the median value. This could mean that year 7’s and 8 have a varying IQ level more than any other year group. This statement backs up my hypothesis previously. This information also suggests that year 11 fall within a more closely packed inter quartile range.
After all my research I found out that the older the students the worse key stage 2 results they had. So for example a when a current year 7 becomes a year 11 that student will have worse results than a new year 7.