We chose to use the computer to measure the speed as this was a more accurate method than timing it using a stop clock.
We chose to use gradient intervals of five books as this would produce results that were more dramatic so would show a more obvious pattern.
Fair test
To ensure that our results were valid the following measures had to be maintained:
- We have to use the same trolley and slope for each experiment – If the trolley was changed, the change in mass could affect the speed of the trolley. If the slope was changed, the surface could be different so it could produce more/less friction so the test would not be valid.
- We have to use the same type of books for each experiment – If the thickness of the book were to altar, the gradient would change so the results would not be valid.
Prediction
I predict that the higher the gradient of the slope, the faster the trolley will go. This prediction is based on previous years of scientific knowledge and Isaac Newton’s theory that ‘Extra Slope = Extra force’.
Preliminary Experiment
In our preliminary experiment we were trying to find what slope gradient (how many books) would be appropriate to begin at and use for intervals. Here were our results.
We found that the trolley only began to move after a minimum of five books had been placed under the ramp.
We also used the preliminary experiment to find out what intervals to use, we decided to use intervals of 5 books each time as this would produce more dramatic results and therefore the results would produce a clearer pattern.
Obtaining evidence
Table of results
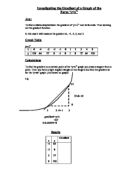
Graph
N.B – line of best fit has been drawn by hand
Conclusion
In our experiment we found that the height of the gradient affected the level of air resistance, e.g. the more higher the gradient, the lower the air resistance.
From the line of best fit on the graph, we can predict an approximate speed for a trolley at any gradient between 5 and 30 books.
The graph shows a proportional relationship between slope and speed. For each unit of extra slope, the trolley has a unit of extra speed.
Extra slope = Extra force
The graph and table both show a clear positive relationship between the slope and speed. This shows that the gradient of a slope affects the speed of a moving vehicle.
From these results we could work out the time it took the trolley to travel through each gradient using Isaac Newton’s formulae: Speed = distance ÷ time
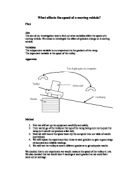
The diagram below shows the forces acting upon the trolley in our experiment:
Evaluating Evidence
Results
Judging from the table and graph produced (see above) I would say that our results were very accurate. All of our results were close to the line of best fit and we did not find any anomalous results which would suggest that we stuck to our method well. I feel that part of the reason why our results were so accurate was that they were
recorded by a computer via light gates, we could not have timed the trolley so accurately using stop clocks or other devices.
Our results cover a wide range which supports our conclusion and allows us to see the shape of the graph easily. Using the graph we could predict other values for new gradients.
Method
Possible causes of error could include
- The force on the trolley being pushed down the ramp
- Wind in the form of a light breeze assisting the trolley along the ramp
Improvements to make the method more reliable could include using the same person each time to let go of the trolley to ensure that the same force was exerted on the trolley each go
Further work to extend the investigation could include experimenting with the mass of the trolley by using weights to see how they affect the trolley, or measuring the acceleration of a trolley with a changing gradient (rather than measuring the speed).