Questions section
In this section, I will answer the questions that I have devised, using graphs and tables to help:
Question one: What is the relation between height and weight for the whole year?
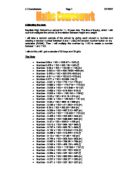
As mentioned earlier, this will be decided using a scatter graph. Firstly though, the information from the whole year needs to be broken up in order to make the graph readable. This is known as 'random sampling'. What will happen is that every 10th person in the whole year will be taken, therefore keeping the results random, but narrowing them down at the same time. Here is the table that shows every 10th person in the year:
These have been ordered by weight, so as you can see, the weights are very randomly organised.
Here is the scatter graph that will determine the overall relation between height and weight:
As you can see, there is an overall positive correlation between height and weight. This means that on the whole, weight increases as height does. This fits with my prediction that as people in the year are taller, they are heavier. There was one anomalous result however: the person circled in red. This person was around 1.06 metres tall, but weighed about 74kg. This person obviously held a different body composition from the rest of the year, in that they were quite large. This body composition factor can be used to explain a lot of the inaccuracy in this set of results, since someone's body composition can affect their height to weight ratio. The only way this graph could have been entirely accurate is if everyone in the year had had the exact same body composition (the same amount of muscle to fat), but this would not happen due to everyone having different eating habits and diets, etc.