Method: The exercise done will be in the form of running. The same track will be run each time and multiple checkpoints will be set out along the track. These checkpoints will be designated a certain time which will be kept for each time the track is run, by this an even paste will be kept for each occasion. The track goes up and down some hills and therefore it is important that the pulse is checked at the same points along the track. If the pulse is checked after running uphill, it will be much higher than if it is measured after running down a slope. But since the pulse will be checked at the same point, after the same time, the different values will be comparable.
The pulse will be checked at four different times during each run. First the resting pulse will be measured before the jogging starts. Then it will be measured after 15 minutes and then as the running ends, after 30 minutes. Then it will be measured again after 5 minutes of resting.
How good the fitness is can be checked by looking at the resting pulse and at the pulse after some exercise. Another way to measure fitness is to see how fast the body recovers, which is seen from how fast the pulse is decreased when the body is at rest.
The running is performed at 5 different occasions during 9 days with one day of resting between the days of running.
Data:
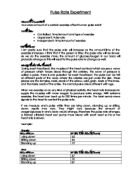
Pulses in beats per minute.
From this diagram it is clearly seen that the resting pulse steadily decreased during the period of exercise. From 85 beats per minute to 62.
Here it can be seen that there was a slight decrease of the pulse after 15 minutes of exercise during the period of the experiment, though at the last occasion the pulse more or less went back to the value it had at the first occasion.
This diagram shows how fast the pulse decreased during rest for each occasion. It shows that the fastest recovery was at the first occasion and that it got slower during the time of exercise but went back towards the value from the first occasion at the last time.
This was calculated by taking the difference between the pulse at the end of exercise and after 5 minutes of resting and dividing it by the number of minutes of resting. For example, for the first occasion: (192 – 110) / 5 = 16.4 (beats/min/min)
Conclusion: The three different diagrams show on different changes of fitness. The first showed an increase in fitness during the period of exercise (lower resting pulse), which the second also did (lower pulse for the same amount of work).
But the third shows on the opposite. The first occasion of exercise had the fastest recovery which shows on the best fitness. Due to these contradictive results no conclusion can be drawn from this experiment.
Evaluation: The size of this experiment was the one limiting factor. The character of the investigation prevents the time span to be lengthened but it should include more people to give more values.
When trying to isolate the fitness of the test subject as the single variable one thing was neglected, the weather. The experiment was done in winter time and the temperature varied between -5 and -15 for the different occasions. Also the amount of snow was varied and the track was not always recently cleared of snow and this did significantly affect how strenuous the exercise was. One possible improvement that could be done would be to do the experiment indoors were the external environment can be kept more constant.
It was in the evening that the running was done, but the time between dinner and the running varied. This could cause different results since if the running took place soon after eating the body was digesting and processing the food and less oxygen would be available to the muscles.
If the pulse would have been checked more often, maybe for each five minutes, graphs of time vs. pulse of the different occasions could be compared to see changes.