If the diameter of a wire increases then the amount of material will increase thus increasing the number of positively charged ions and electrons. There is also an increases amount of space for the electrons to flow through because there is less opposition to the current so a decrease in resistance.
If the temperature of the wire increases then the fixed positive ions will vibrate faster increasing their amplitude of there vibrations so the number of collisions with electrons will increase so the resistance increases.
Sources
Syllabus Facts and AQA revision guide
Planning
Aim
To find out how the resistance of a given wire varies with its length
Independent Variable
The length of the wire is the variable we will be changing.
Dependent Variable
The variable we will be measuring is the resistance of the wire. We will be calculating this by measuring the potential difference across the specimen wire and current through the specimen wire.
Prediction
As the length of the wire increases the resistance will increase.
The resistance will be directly proportional to the length. This means that is the length of the wire doubles the amount of resistance will also double.
If the wire is 5cm and the resistance is 10Ω and the resistance is directly proportional to length that means if the wire was 10 cm the resistance is 20Ω.
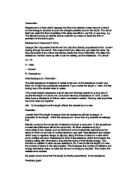
Graph to show the resistance against length
I think that the resistance will increase because as the length of a wire increases the number of electrons and positively charged ions increase. This means that there will be more collisions of electrons with the positively charged ions. The positive ions are creating an obstruction so the more there are the greater the obstruction so the greater the resistance will be.
I expect that if I double the length of the wire the resistance will double because I am doubling the number of particles of ions and electrons resulting in twice the amount of collisions.
Preliminary Results
From previous experiments and studies of circuits and on the characteristic curves of various conductors, I learnt:
- Components in a circuit cause resistance
- Resistance can be calculated by dividing potential difference by the current
- An ammeter is connected in series and measures current
- A voltmeter is connected parallel to the circuit and measures the potential difference
- If the current goes above 1 amp then significant heat is produced and resistance is increased as temperature increases
Objectives
From the preliminary trials we are trying to determine the final circuit diagram, to do this we are tying to decide on the best and most suitable equipment for the investigation for example we are trying to find out which is the best power source to use out of a cell and a battery.
We will be trying to find our fixed voltage suitable for all lengths of wire, and a current reading below one amp. From this we will be able to determine the range of lengths we will use to give us the widest results but at the same time keeping the experiment safe.
Table to show results from preliminary trials
Conclusions
The preliminary trials were successful we achieved all our objectives. For the power source we decided to use a cell because the voltage was much easier to control because its maximum potential difference is a lot smaller than that of a battery, and we found it hard to keep at a constant voltage suitable for all lengths of wire. Now that we had decided on the apparatus the circuit diagram could be completed and finalised. Our predetermined voltage is 0.60V the current remain under one amp for all lengths of wire. We final concluded that we would take our readings from 20cm of wire to 200cm of wire and record the current at 20cm intervals.
Safety
To ensure that this experiment is safe I will be making sure I
- Use a switch and disconnect the circuit when I am changing the length of the wire.
- Avoid unnecessary path of undesired current creating a short circuit.
- I will keep water away from the apparatus so there is no possibility of creating a short circuit which may also to significant heat being produced
- I will keep the current below one amp because if it goes above one amp the circuit will heat up significantly and there will be a chance of burns from the specimen wire.
Apparatus
Method
- Measure the length of the wire with a ruler
- Set up the circuit as in the diagram
- Place the length of wire in the circuit
- Set the rheostat to a predetermined fixed potential difference
- Check potential difference correct on the voltmeter
- Read the ammeter
- Repeat experiment for reliability and accuracy
- Repeat whole experiment for a wide range of lengths for meaningful results
- Calculate the average of all results for accuracy and a reliability of results
- Draw a results table
-
Calculate the resistance (= Potential difference
Current)
- Draw a graph of resistance against length for clear analysis of results
Note: For the different lengths of wire we did not cut the specimen. This was because the cutting of the wire would have compressed and reduced the diameter of the wire, which would in turn cause a greater resistance. We also didn’t cut the wire because that would mean we were unable to reinvestigate any anomalous results.
To ensure that the experiment is fair I will be controlling -
- The potential difference and keeping it the same number of volts through out the whole experiment. To do this I will adjust the rheostat and measure the potential difference on the voltmeter to ensure it is the same.
- I will be keeping the cross sectional area of the wire the same because if there is a change in the cross sectional resistance will change this would make the experiment unfair and biased.
- I will be measuring the air temperature each time before I start the experiment to ensure it is the same. I will also be keeping the current below one amp because if the current goes above this then it will cause the wire to heat up significantly, which will increase the temperature and resistance because the ions have greater amplitude of vibration, there for increasing the amount of collisions.
- The density, configuration, and material of the wire are all constant variables they are kept the same to ensure a fair test.
Diagram of apparatus
Analysing and Considering Evidence
Conclusion
From the graph of resistance against length we can see that as the length increases the resistance increases. The graph is linear and the line of best-fit passes threw the origin. This means that the data on the graph is directly proportional.
If the length is 60cm then the resistance is 2.0Ω because the graph is said to be directly proportional then the resistance in a piece of 120cm constantan wire would be 4.0Ω. This was found to be true from the data we collected and displayed on the graph.
The resistance in the constantan wire is caused by an opposing force opposite to the flow of the electrons in the electrical current. The resistance in the length of the wire is caused by the positively charged ions, the greater the number of ions the greater the obstruction to the flow of electrons. The resistance increased because as the length of wire increased the number of electrons and positively charged ions increase resulting in an increased number of collisions. The resistance is directly proportional because the atoms in the wire are evenly distributed so increase evenly at every reading, e.g. if there were 10 atoms in a piece of 10cm wire there would be 20 atoms in a 20cm piece of wire, because of this the number of electrons and positively charged ions are also increased evenly resulting in and increased number of collisions. Thus increasing the resistance so it is directly proportional.
Comparison with Prediction
The prediction I made was true. The resistance increased as the length increased, and the resistance is directly proportional to the length of constantan wire. This is true within the range of values we investigated.
Evaluation Evidence
Inaccuracies
In this investigation there were factors that couldn’t be controlled.
- The room temperature, was one such factor, it is an environmental factor so is hard to control. If the room temperature fluctuated from hot to cold through out the experiment then this could have effected the results because if the temperature got hotter then the ions in the wire would heat up and vibrate faster causing a greater obstruction and increasing the resistance.
- The temperature of the wire was another factor. Even though through out the investigation we kept the current below one amp, the flow of the electrons and the collisions with the ions would have created friction, this friction would create some heat, which would increase the vibrations of the ions and increased the resistance.
- The supply of voltage from the battery is also a factor, we could not guarantee that the potential difference was constant, however this would not have had too much of an effect on the investigation because we used the rheostat to control the voltage across the wire.
The main problems we had with the accuracy of the experiment was with the wire and the measuring of it. The specimen of constantan wire had kinks in and was not completely straight. This inaccuracy could have affected the results because we may not have been measuring at exactly 20cm intervals because there was a bend or kink in the wire that could not be straightened. The another problem we had with the accuracy of the measurements was because we only had a 1m ruler so when we were measuring over a meter we had to mark 100cm and then move the ruler to measure the rest of the wire this could have lead to slight mistakes because the 100cm may not have been marked exactly, we also found that the ruler did not start a 0cm this was because the number had been worn away. The kinks in the wire, caused the area of the cross section to change this could have altered the resistance because the ions would have been compacted together and created a greater obstruction therefore increasing resistance.
Anomalous Results
From the readings we took we found no anomalous results, they all fitted on or close to the line of best fit. All our results fitted with the general trend of the resistance being directly proportional to the length.
I feel that from the evidence we collected that the data is good enough to support a firm conclusion. All the points are close to or on the line of best fit. We repeated the experiment and took averages for accuracy and reliability of our results, we also measured to the closest accuracy and used the most accurate equipment available to us. I feel that this evidence is safe to support the conclusion that resistance is directly proportional to length for the range of values and material we tested.
Improvements
Our investigation could have been improved; these are the ways that I think it could have been done to improve the reliability of the evidence.
- We could have used a ridged ruler of more than 2 meters, so there would be no inaccuracies with the measurements.
- If we had a straight piece of wire then that also would have made the measurements more accurate.
- If we had a wider range of results, e.g. measure the resistance at 10cm intervals along the wire.
- We could have taken more repeat readings to increase the reliably of the results.
- We also could have used a data logger, which would have recorded the ammeter and voltmeter and plots the graph automatically; if this was done then we could use it for an even wider range of results, increasing the accuracy of the experiment even more.
Further Work
This investigation could be extended to give more accurate and meaningful results and to see what other factor could influence a change in resistance. Here are some other factors that can be investigated.
- Increase the length we measured beyond 2 metres, but keep the voltage, material, temperature and the diameter the same.
- Change the material of the wire but keep the lengths and voltage, temperature and diameter constant.
- Change the voltage but keep the material of the wire, the diameter, temperature and the lengths the same.
- Change the environmental temperature, but keep the material, diameter, lengths and voltage the same.
- Change the diameter of the wire but keep the material, voltage, temperature and lengths the same.
All of these different experiments would help the comparison and help further investigate what factors affect resistance.