Apparatus:
6 Large test tubes.
2 (250ml) Beakers.
2 Syringes.
1 Size 3 cork borer.
1 Tile.
1 Petri dish.
1 Stopwatch.
1 Large potato.
1 Scalpel.
1 Glass rod.
1 Ruler. 15cm or 30cm.
Distilled water.
Saturated Salt solution.
Electronic balance.
Detailed Method:
- Fill one beaker with 200ml of distilled water. Fill the other beaker with 200ml of saturated slat solution.
- Next make up the various concentrations of salt solution. Use one syringe for each beaker. Ensure that each syringe only ever contains one solution, do not mix or forget which syringe goes into which solution, i.e. one syringe for distilled water and the other for the saturated salt solution, this is so that the distilled water or saturated salt solution aren’t contaminated. Fill one syringe with the indicated amount of distilled water and fill the other syringe with the indicated amount of saturated salt solution. Empty both the syringes into one test tubes and then refill them to the indicated amount for the next concentration and repeat the process.
-100%: 5ml of saturated salt solution. 0ml of water.
-80% : 4ml of saturated salt solution. 1ml of water.
-60% : 3ml of saturated salt solution. 2ml of water.
-40% : 2ml of saturated salt solution. 3ml of water.
-20% :1ml of saturated salt solution. 4ml of water.
-0% :0ml of saturated salt solution. 5ml of water. (this is done as a control)
remember to use a separate labelled test tube for each one and once the syringe has been emptied mix each test tube well with a glass rod.
3) Put the potato on the tile and ensure that the potato remains on the tile during the cutting process. Use the cork borer to extract 2 full cylinders from the potatoes. Use the glass rod to remove the cylinders from the potato by inserting the rod at one end of the borer and pushing the potato cylinder out. Remove the brown potato skin from each end of the potato. Use the ruler to measure out 5mm pieces from both cylinders. Cut six (5mm) pieces with the sharp edge of the scalpel. Ensure that each cut is straight and not at an angle so that all the edges of the potato pieces are equally straight and not slanted. If more cylinders are needed extract them as required, the potato is a limited resource, do not create unnecessary cylinders of potato.
4) Weigh the mass of each potato by placing it on the electronic balance. Use a folded piece of tissue paper to ensure the balance remains dry. Remember to ‘tear’ the balance after each reading. Record the mass (to 2dp) from the balance of each piece in a results table under a column entitled ‘starting mass (g)’. After weighing each piece ensure you do not forget its mass. Find a way to ensure none of the pieces are mixed up, for example you could place each potato after it’s been weighed in front of the test tube (full of salt solution) that you will place it in. This is vital in ensuring the experiment is successful.
- Place the first piece of potato in its allocated test tube and begin the stopwatch. Stagger the placing of each potato in its allocated test tube by one minute, this allows time to take each result at the end. After one minute place the second piece of potato in its test tube, after two minutes place the third piece of potato in its test tube, continue to stagger the results at one minute intervals until all the pieces have been placed in their test tubes.
6)
After twenty minutes remove the piece of potato that was inserted first. Pour all the contents of the test tube into the petri dish. Remove the piece of potato and delicately dry it, attempt to remove as much water as possible without damaging the potato. ‘Tear’ the electronic balance before placing the piece of potato on the tissue paper that lays on the balances tray. Take the reading (to 2dp) and record it in the results table under a column entitled ‘ending mass (g)’. If this process is done quickly it should take less than a minute. The staggering of the results at the beginning of the experiment allows you time to quickly take the results. After the first result is taken pour the contents of the petri dish down the sink and prepare to take the result of the second piece of potato. Repeat the process above for the second piece of potato, ensure that there is only a one minute gap between taking each result, do not allow they potato pieces to have longer time than allocated in the solution. Continue with the process at one minute intervals until all the pieces of potatoes have had results recorded from them. Remember to ‘tear’ the balance before recording each result.
7) Repeat the experiment at least once more, twice if possible. Run thought the exact method and steps shown above. However, you may wish to alter the method after taking the first run of results.
- After recording the results in a table (including the repeats) add a column entitled ‘change in mass (g)’. In this column record the change in mass by subtracting the starting mass from the ending mass, do this for each concentration. The results may be processed and a graph must be drawn from them.
OBTAINING EVIDENCE
Alterations Made to the Method During the Repeat Results: During the time in between the original and repeat results I was able to analysis my method in further detail and to discover problems that I could correct during my repeat results. These were only small changes but contributed to the overall accuracy of the repeat results.
-Instead of cutting 5mm pieces from the cylinders 1cm pieces were cut in exactly the same fashion. This allowed the experiment to work at a faster rate and it gave better results because there was a larger surface area of potato exposed for osmosis to occur on.
-The amount of solution was increased to 10ml instead of a 5ml solution. This allowed there to be enough solution for the experiment to occur with a larger piece of potato (potato size must = size of solution). Therefore a 10mm potato piece requires a 10ml solution for the experiment to work well. A larger solution also allows the same two effects above (faster rate and better results).
-In the original method all the potato pieces were weighed separately and their masses recorded, then they were put in their allocated solutions at one minute intervals. In my repeated method I cut all the pieces and weighed each one before putting it in its solution. E.g. I weighed the first piece, put it in its solution and started the stopwatch. During the minute interval I weighed the second piece of potato before putting it in its solution after 1 minute, the minute interval between the second and third potato pieces was used to record the mass of the third piece of potato and so on. This allowed the experiment to be run in a far more efficient and quick manner. The removal of the potato from the solution was done in the same manner as described in the original method.
How I processed my raw results: My output variable (i.e. the variable measured) was mass/change in mass. I calculated the change in mass by weighing the potato before and after it was put in the solution, these two masses: starting mass and ending mass were then used to calculate the finishing mass:
Ending Mass – Starting mass = Change in mass
E.g. 21g – 13g = 8g
These change in masses showed how the change in concentration had effected osmosis in the potato. However, it is difficult to compare the change in masses fairly in a graph or results table because some potatoes may have different starting masses, i.e. the data may be misleadingly represented by drawing a graph by looking at change in mass.
E.g. Piece 1: Starting Mass = 50g. Change in Mass = 5g.
Piece 2: Starting Mass = 10g. Change in Mass = 5g.
Both pieces have the same change in mass, however, when put in context the first piece of potato has only had a 10% change in mass compared to its starting mass whereas the second piece has had a 50% change in mass compared to its starting mass. By only looking at the change in mass we can mistakenly believe that both these potatoes have had the same change in mass compared to their starting mass. To get around this problem we must process the results obtained rather than just working out the change in mass. To process the results further I found it best to process the results into a percentage change.
(Ending Mass/Starting Mass) * 100 = Percentage after compared to start.
((Ending Mass/Starting Mass) * 100) – 100 = Percentage Change.
By processing the results into ‘percentage change’ and plotting a graph from this we can gain a clear fair picture of the results obtained.
Results:
Error! Not a valid link.
ANALYSING EVIDENCE AND DRAWING CONCLUSIONS
Patterns Displayed by the Graphs: Two graphs were drawn both showed the same patterns but from different angles. The best-fit line drawn from the graph indicates that at low concentrations (40% and below) there is a gain in mass in the potatoes, the best-fit line also shows that at higher concentrations the potato has a loss in mass. It also seems true that as the concentration becomes lower the gain in mass is increased and at high concentrations the loss in mass becomes greater, but, this theory is not backed up by my original results which contain anomalies and are slightly ambiguous. My original results suggest the same idea as my repeat results: that at low concentrations there is gain in mass and at high concentrations there is a loss in mass. However, my original results do not support the statement: as the concentration becomes lower the gain in mass is increased and as the concentration becomes higher the loss in mass becomes greater because they are not accurate enough to prove this true.
The two different graphs (one of change in mass and the other of percentage change) both give very similar best-fit lines. The only difference is that one results shows raw data and the other processed results, so it is credible for both graphs to have exactly the same patterns (see above) and exactly the same best-fit lines.
Conclusion: The conclusion that I can draw from the results obtained we can see osmosis at low concentrations (below 30%) causes a gain in mass, at high concentration (above 30%) there is an loss in mass in the potato. At concentrations around 30% there is neither a gain or loss in mass, although I did not do a test with a concentration of 30% this conclusion can still be drawn because at 40% concentration there was only a slight loss in mass and at 20% concentration there was only a slight loss in gain. Therefore it is rational to say that there is no mass change at 30% concentration the average of 20% and 40% concentrations.
Also, we can see that 20 minutes was a sufficient enough time for osmosis to occur over to receive reasonable results that could be plotted in a graph, however, it seems likely that it would have been more practical and we would have received more scientifically accurate results if the potato was given more time for osmosis to occur over. Lastly we can conclude that the potato had no change in mass at 30% because its WP was the same as the solutions and that the potatoes water concentration was around 70% (this is due to the fact that there’s no change at a solution of 30% salt and 70% water).
Relating the Conclusion to Scientific Knowledge/Understanding: The water concentration must be around 70% because of the theory and rules of osmosis. Osmosis states that if the WP is the same outside the cell as inside the cell then osmosis won’t occur. Osmosis not occurring in this context means that there is no loss or gain in mass of the potato, i.e. the mass stays the same. At a 30% salt concentration and 70% water concentrated solution there is no change in mass in the potato. Therefore it must mean that the WP inside the potato is the same as outside the potato, i.e. the concentration of water outside the potato is exactly the same as inside the potato. Essentially the osmosis didn’t occur because the WP inside the potato was the same as outside the potato (osmosis couldn’t occur because it requires an area of higher and an area of lower WP as opposed to two areas of equal WP). Therefore this explains why potatoes have a water concentration of 70%.
My conclusion stated that osmosis only required 20 minutes to occur. This is true to an extent: yes it does only require 20 minutes to occur sufficiently to give us useable results, i.e. the results were sufficient enough to produce a graph from therefore osmosis can occur in shorter periods of time e.g. 20 minutes. But, for it to fully work it requires a longer period of time.
This leads to understanding why the potato gains mass at concentrations below 30% and gains mass at concentrations above 30%. This is due to the laws of osmosis. With a solution of 20% salt and 80% water concentration outside the potato cells then the solution outside the cell must have a higher water potential than the solution inside the potato cell (remember that the potato cells only have a 70% water concentration which has a lower WP than the 80% water concentration of the solution outside the potato cell). Therefore the water diffuses from the higher WP of the 80% water concentrated solution outside the potato cell across the semi-permeable membrane and into the cell which has the solution with the lower WP of a 70% water concentrated solution. Therefore the diffusion of water into the potato cells lead to an increase in mass in the potato.
At concentrations of 30% and above the potato lost mass because the solutions of 60% salt and 40% water had a lower WP than the higher WP of the 70% water concentration of the potato. Therefore if the water moves from areas of high WP to low WP the water diffuses out of the potato across the semi-permeable membrane and into salt solution. The diffusion of the water out of the potato cells lead to a decrease in mass in the potato.
Relating the Conclusion to My Prediction:
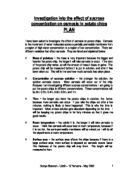
My prediction stated that: I predict that as the concentration of the salt solution outside the potato increases the potato mass will decrease because more water is lost through osmosis.
As well I predict that there will be a certain level of concentration where the potato will neither gain or loss mass and below this concentration the potato will gain mass.
I also predict that at a certain concentration the potatoes will plasmolysis and at levels of concentration higher than this the change in mass will be exactly the same as the level where the potato first became plasmolysised.
The conclusion that I drew from the graphs and the patterns of the graphs supports the predictions made, this would indicate that the reasoning behind my prediction was right and they’re correct. The first prediction was backed up by the conclusion and graph, the graph showed that at high concentrations there was a great negative change in the mass of the potato, i.e. as the salt concentrations became gradually greater the loss in mass also became gradually greater.
The graph and conclusion also proved this statement was correct, the graph and conclusion showed that that at approx. 30% salt concentration there was no change in mass. Therefore this is the level that the potato has the same WP as the solution outside (therefore potato has a water concentration of 70%). The graph also indicated at levels of concentration below this there was a gain in mass in mass in the potato. The conclusion also proved this. It stating that below levels of 30% salt concentration there was a gain in mass in the potato because the solution outside had a higher WP (it had a greater water concentration) therefore water diffused into the potato via osmosis and there was a gain in mass in the potato.
I believe that this statement is true, however, the conclusion doesn’t back this up. There is nothing in the conclusion that shows that after a certain level of high concentration the change in masses remain the same. But, I still believe the statement to be true because the potatoes were not given long enough to fully plasmolysis (20 minutes) therefore the potatoes did not reach a level of water loss where they could plasmolysise in the time given. Therefore for there to be Wall Pressure and the change in masses to be the same at very high concentrations the potatoes must be given long enough to plasmolysis and 20 minutes is not sufficient time (about 3-4 hours would be sufficient).
EVALUTION
Comments on the Procedure and Method: This experiment was done two times and during the repeat method an altered and improved method was used, therefore when discussing the efficiency of the procedure I must look at both the original method and the improved method.
My original method was inaccurate and suffered from some problems, the results from the first set of results indicate that this is true. During my first experiment the method was accurate, however, it contained certain problems. Firstly the potato pieces were to small. They only measured 5mm long. The pieces were cut in an accurate manner with a 15cm ruler that measured to the nearest mm: more than sufficiently accurate in terms of this experiment. The fact that the potato pieces were to small meant that osmosis didn’t have enough time to occur over the twenty minute period. By increasing the size of the potato the surface area that osmosis can occur over is increased, therefore the rate of osmosis is increased and osmosis can occur sufficiently during a twenty minute period to give us results that contain no anomalies. I also increased the amount of solution from 5ml to 10ml. This had the same effect as increasing the size of the potato. These two problems were corrected after the first run and allowed the procedure to be improved during the second results.
In terms of accuracy the experiment was a good one. The accuracy was satisfactory in numerous ways, firstly the potatoes were all accurately the same size, the cork borer ensured that each cylinder was precisely the same size. Once the cylinder had been bored a 15cm ruler that measured in mm ensured that the potato were all either 5mm or 10mm long. The ruler measured in mm a measurement which is more than satisfactory for this experiment, this ensured that all the potato pieces were the same size. The syringes that were used to create the solutions measured to the nearest 0.1ml. This allowed the solutions to be created to a very high standard of accuracy (within 1% concentration of what the solution should be), this meant I could find no fault in this area. The electronic balance was also accurate to the nearest 0.01g. This may seem accurate overall, however, when put in the context of this experiment this accuracy is needed because this experiment deals with very small masses (the change in masses ranged from only 0.01 to 0.08).
Comments on the Data Gathered: The reliability and amount of anomalies from the first set and second set of results varied by a large amount.
The first set of results showed a pattern that could be drawn into a best-fit line. However, this best-fit line couldn’t be trusted because it contained anomalies. I.e. the results showed a relatively low negative correlation. Because a majority of the results fell away from the best-fit line the conclusion drawn from this best-fit line couldn’t be trusted on the basis that it was concluded from anomalous results. These poor results for the first set of results can be explained due to the problems of the procedure of the original method. The main problem was the fact that the potato was not of a large enough size to allow enough surface area to be exposed for osmosis to occur on. Therefore osmosis couldn’t occur properly over the twenty minute period. Since osmosis couldn’t occur properly the results received in the first run of the method contained anomalies.
My second run provided high quality results. They produced a best-fit line of a high negative correlation. All the results fell close to the best-fit line and as a result it provided a good solid conclusion. These good results were due to discovering the poor results in the original method and correcting the faults in the method for the repeat results. It seems that some other classmates also suffered from poor results in both their original and repeat results, this would indicate that using to small a potato size e.g. 5mm was a large problem in causing anomalous results.
Although my repeat results contained no anomalies how good was the reliability of the experiment. Reliability is essentially the amount of repeated results there are, an experiment with four repeat runs is said to be very reliable but a experiment with no repeated runs is unreliable. This experiment has only one repeat runs, more would have been done but time was a limiting factor. However, only one repeat run is required to provide sufficiently reliable results for this experiment. But, reliability is not solely the number of times an experiment is done, if you do an experiment twice and both times the results come out exactly the same then the experiment is reliable, but, if you do a experiment six times and every time you come out with a completely different set of results then the experiment is unreliable. Therefore this experiment is only fairly reliable because its repeated once but there is a discrepancy between the first and second set of results.
How Firm is my Conclusion?: The firmness of my conclusion depends on the number of anomalies and the reliability of the results. Although the second set of results greatly support the conclusion and tie in with it the first set of results detract from this because they contain a number of anomalous results. Fundamentally both my best-fit lines support the conclusion: that at low concentration there is a gain in mass and at high concentrations there is a loss in mass. The original results detract from the firmness of the conclusion because of the anomalous results and the fact that they reduce the reliability of the experiment.
However, the conclusion can be said to be firm because both the experiments supported the statement and the repeat run firmly indicated that the conclusion was entirely true.
Improvements and Further Work: There are number of alterations and improvements that could be added to the method which would allow us to investigate further into the area of osmosis in biology.
-You could investigate osmosis further by seeing the effect of concentration of different types of potatoes or using entirely different plants (e.g. plants, other vegetables, fruits or a different type of potato). This would test how different semi-permeable membrane could effect osmosis and the movement of water out and into organisms.
-You could investigate the time it would take for potato cells to plasmolysis. I.e. you could investigate using extremely low or high concentrations with potatoes. This would allow you to see how long it would take the potato to plasmolysis and die.
-You could do the experiment using a longer period of time for osmosis to occur. By doing this you could investigate how long it takes for osmosis to fully complete. It could also be connected to the above improvement in finding how long it takes for the potato cells to plasmolysis. E.g. use a 3 hour or longer 24 hour period.
-You could do an investigation into how changing surface area and the amount of solution affects the rate/how long it for osmosis to occur.
-You could do an investigation into how osmosis is affected when it occurs it different conditions, i.e. how osmosis occurs under high or low temperatures. You could also investigate the amount of heat that the semi-permeable can withstand before the membrane is disrupted. After this you could expose the potato to a certain amount of heat, a large amount (but not enough to completely disrupt the membrane) and then you could see how exposing the potato to heat beforehand affects osmosis.