Temperature, pH and the presence of inhibitors can all alter the structure of the molecule thus causing differences in reaction rate of the enzyme. Since one molecule of Catalase can break 40 million molecules of hydrogen peroxide per second (at room temperature), I will test the effect of enzyme concentration on reaction rate also.
Hypothesis
Reaction rate will increase as enzyme concentration increases.
Reaction rate will reach an optimum value at a pH of between 7 to 8.
Reaction rate will increase as temperature increases up to a temperature of between 35-40 °C where reaction rate will peak. After this point, the reaction rate will decrease as the temperature rises.
Reaction rate will fall as the concentration of inhibitors rises.
Procedure
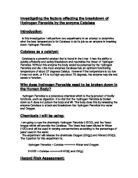
Apparatus was set up as in the above diagram.
A pH 7 buffer is produced as shown in the table on the next page. This is the buffer used in all experiments but experiment 2 where the buffer pH is altered.
A 4% Yeast solution is made up by mixing 1g of Yeast powder with distilled water. The concentration of the solution of Yeast is never changed. The Yeast produces the Catalase enzyme very quickly when in an environment with a high concentration of Hydrogen Peroxide.
For each experiment, once the syringe has been fully depressed the stop clock is started. Each experiment is repeated three times so a fair average can be obtained.
Volume of Oxygen produced from the reaction is measured using the gas syringe.
Experiment 1 - The Effect of Variation of Enzyme Concentration
The reaction mixture is made up of 10ml pH 7 buffer mixed with 5ml of 10 Moll¯¹Hydrogen peroxide solution. Enzyme concentration is altered by varying the volume of Yeast solution added to the reaction mixture via the syringe. The experiment is performed with 0, 1, 2 and 3ml of Yeast solution added. The volume of Oxygen produced is measured every ten seconds for a period of ninety seconds.
Experiment 2 – The Effect of Variation of pH
Buffers of different pH values are produced using the volumes of solution shown below:
Solution A: 0.2M NaH2PO4
Solution B: 0.2M Na2HPO4
Solution C: 0.1M Glycine
0.1M NaCl
Solution D: 0.1M NaOH
Note that the Phosphate buffers must have 100ml distilled water added to each mixture.
The reaction mixture is made up using 10ml of buffer of a particular pH with 5ml 10 Moll¯¹Hydrogen Peroxide. For each experiment 1ml Yeast solution is added to start the reaction.
Experiment 3 – The Effect of Variation of Temperature
To perform this experiment the use of a water bath is employed to raise the temperature. To lower the temperature, cooled water or ice is used in a basin. The conical flask is partially submerged in either to cool/ heat the reaction mixture. The reaction mixture is made up of 10ml pH 7 buffer mixed with 5ml 10 Moll¯¹Hydrogen Peroxide. 1ml Yeast solution is used to start the reaction. Only temperature is altered in the experiment. Temperatures of 0, 10 ,20, 30, 40, 50 and 60°C are used.
Experiment 4 – The effect of inhibitors
Using the same apparatus as in experiment 1 and 2, a reaction mixture of 9ml pH 7 buffer, 5ml 10 Moll¯¹Hydrogen Peroxide and 1ml inhibitor solution is produced and reacted with 1ml Yeast solution. Inhibitor solutions of different concentrations are used; 1, 0.75, 0.5, 0.25 and 0.1 Moll¯¹solutions are used. The inhibitor I chose was Copper (II) Sulphate solution.
Results
Experiment 1 - The Effect of Variation of Enzyme Concentration
Experiment 2 – The Effect of Variation of pH
Experiment 3 – The Effect of Variation of Temperature
Experiment 4 – The effect of inhibitors
Discussion
Conclusion
Most of the results showed the hypothesis to be correct. Reaction rate increased as the enzyme concentration increased by varying the volume of 4% Yeast solution added. The reaction rate was optimum at a pH of 9, which was close to the hypothesis of between 7 and 8. This hypothesis was made due to the fact that blood is slightly alkaline and Catalase must work efficiently in these conditions to prevent the cells of the body being contaminated by Hydrogen Peroxide. The results showed that reaction rate increased continuously as temperature rises. This is a scientific impossibility since the Catalase enzyme denatures above 45°C and so there would be no reaction (and therefore no oxygen produced) above this temperature. This will be further discussed in the evaluation. Reaction rate fell as the inhibitor concentration rose.
Evaluation
Experiment 3 (The Effect of Variation of Temperature) did not work as planned since a gas was produced at the higher temperatures which were not anticipated in the planning of the investigation. The gas was due to evaporation of the reaction mixture at the higher temperatures. The expansion of the air inside the conical flask could also create this effect. This could be seen easily by the steam rising from the contents of the conical flask. Accurate results could only be obtained knowing the exact rate of evaporation of the reaction mixture and the degree of expansion of air inside the conical flask.
In general, the other experiments produced good results which were made more accurate by the two repeats of every experiment, then an average found.
There would have been some small inaccuracies in the results due to occasional poor washing of the apparatus after use. For example when the conical flask was not washed out several times some Yeast/Catalase would remain on the bottom. This could be seen when small bubbles formed when Hydrogen Peroxide was added (this was performed as an experiment after only two cleans of the conical flask – a deliberate error to find out how thorough a wash was required).
For all measurements of solutions, different sizes of pipettes were used. There were some inaccuracies in the actual measurement to the liquids (human error) due to poorly checking the position of the bottom of the meniscus against the line of the volume required. Only two granulated pipettes were required, a 1ml and a 10ml pipette. Since many chemicals were used, each time a pipette was used it had to be washed out several times with distilled water. Before the pipette was then reused, it had to be washed out with the chemical it was going to measure. These procedures insured no contamination and inaccuracies in many of the measurements by systematic error.
Once the syringe containing the Yeast solution was depressed, the conical flask was not moved e.g. to swirl the contents around, since this would create too many inaccuracies such as the length of time and force with which the flask was swirled.
The yeast solution was made up each day and disposed of afterwards to ensure a constant 4% solution.
References/Bibliography
Books
Rose, S (1966) The Chemistry of Life, Penguin, p97-107.
Wynn, C. H. (1973) The Structure and Function of Enzymes (Studies in Biology No. 42), Edward Arnold, p43
Websites
Roy B. Clariana (1991) Enzyme Action, Carnegie Institution. Visited March 2003.
URL: http://users.rcn.com/jkimball.ma.ultranet/BiologyPages/E/Enzymes.html
P. Keusch (2000) Kinetics: Enzymatic Decomposition of Hydrogen Peroxide, University of Regensburg Visited March 2003.
URL: http://www.uniregensburg.de/Fakultaeten/nat_Fak_IV/Organische_Chemie/Didaktik/Keusch/cassylab_kat-e.htm
Acknowledgements
I would like to take this opportunity to thank Mr X and the Technician Staff for their great help during this investigation.