I started my preliminary experiment by getting 30cl of dilute sulphuric acid and parts of zinc, iron filings, magnesium filings and magnesium ribbon. We dropped each metal in one by one timing how long the metal took to dissolve.
I have chosen to use magnesium ribbon because it dissolves quickly and it is easy to see dissolving. It allows us to get a good range of results and judge the time accurately.
Plan
For my main experiment I will be using 1cm pieces of magnesium ribbon. I will be using concentrations of acid between 30/0 acid/water and 14/16, these will be altered by each number changing by 2 each time e.g. 28/2.. I will time how long it takes for the 1cm piece of magnesium to dissolve in the solution. For each concentration I will be taking three readings so I am able to get and average for more accurate results.
I predict the results from this will be that the more concentrated the solution the less time the magnesium piece will take to dissolve. This is due to the amount of meaningful collisions being greater with the more concentrated solutions. Therefore the less concentrated the solution the less collisions that will occur
This experiment is reasonably safe, we will be working with an irritant though and we are required to wear safety goggles. We must be careful whenever handling the acid and must ensure to wash out hands after the experiment.
I will start my experiment by getting three beakers full of undiluted acid, we will be using three to find the average for a more accurate set of results. After cutting 1cm of magnesium ribbon I will drop one in each of the solutions and time to see how long it takes to dissolve. I will repeat this technique for all the solutions I am testing.
Concerntration Time (s)
Apparatus
- Sulphuric Acid
- Water
- Beaker
- Stirrer
- Magnesium Ribbon
- Burette
Analysis
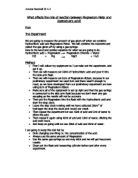
My first graph shows the time it takes a 1cm piece of magnesium ribbon to dissolve in different concentrations. The time is done in seconds and the concentrations in ratios e.g. 14/16
The graph clearly shows that the more acid in the concentration the less time it takes to dissolve. Therefore the more dilute the acid is the longer the magnesium will take to dissolve.
The results of the experiment fit in with my prediction that the higher the concentration of acid the less time the magnesium will take to dissolve. This is because the acid is less dilute which means that the pieces of magnesium will dissolve slower than a more concentrated solution. This occurs as there would be less meaningful collisions.
I found no anomalous results in my experiment. This may be because the readings were taken in controlled circumstances so we were able to perform a fair test.
I believe that I should draw another graph to find out the rate of reactions. I will do this by using the equation.
Speed = Distance
Time
Speed will represent the rate of reaction ( this is what we want to find out ). Distance shall represent the length of the magnesium which is 1cm. We will use the results of the last graph to pt the time into the equation
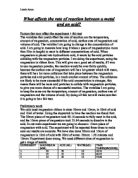
As expected this graph shows that the more acid in the concentration the greater the rate of reaction. This maybe because the more sulphuric acid particles the ore collisions that will occur.
These results fit my prediction that the greater the concentration the greater the rate of reaction or the less time it will take for the magnesium to dissolve.
The previous graph wasn’t as useful as this one, this is because there was a limited amount of solutions for such low concentrations resulting in an upward curve. By working out the rate of reaction we are able to get a straight line and put in a line of best fit.
From my second graph we are able to work out a matmatical relationship between concentration and rate. We call this the gradient and work it out by drawing a triangle on the line of best fit and working out the amount of x in y e.g.
Y = 2X
This would mean y would be the same as whatever x is times by 2.
Our equation for the gradient is:
Y = 0.6X
This means that y is worth 0.6 of x, so if x is worth 20 y is worth 12. this is shown on my graph.
Evaluation
My original graph shows a good spread of results the 3 solutions on each concentration all showed similar results. I found one anomalous result for the 28 acid 2 water concentration, the 3 results were 29, 30 and 36. The 36 could be explained by irregular stirring or poor accuracy in measuring out. But Overall the validility of my results was good with good averages providing the source for 2 good graphs.
My results were reasonably accurate and it was easy to draw first a curve of best ft then a line of best fit on the second graph.
The fact that my results follow a pattern is good as it suggests that my test was fair and regular, in my first graph the results are quite close together in time but begin to spread apart more in the lower concentrations. This may be due to the fact that there was a limited amount of solutions for the lower concentrations.
The spread of my results goes between 30 (s) and 100 (s), although this may seem quite large I have previously explained there maybe a limiting factor in the lower concentrations causing a bigger spread.
My second results have a smaller spread between 0.033 and 0.010, also the decrease in these results was constant and we were able to draw a accurate line of best fit. From this then we were able to work out an equation for the gradient.
I believe that I did enough to ensure a reasonably fair test, by doing this I increased the accuracy and by taking averages I decreased the chance of anomalous results therefore my results were valid.
I found no big anomalous results on my graphs, when doing the experiment I took averages which helped to filter out any anomalous results from my readings, but even I these my results seemed quite constant.
I believe I made my experiment a very fair test. I measured the acid and the water out carefully to ensyre the concentration was correct. I also stirred constantly on every concentration to make sure we has similar results and keep a fair test. The results on my graphs reflect this by following a curve and line of best fit.
Due to the small amount of solution we used the smaller concentrations there became less sulphuric acid particles which meant there was a less effective collisions. The only way this could have been prevented if there was a infinite amount of acid which would make the loss of concentration irrelevant.
We could improve the experiment by using a micrometer screw gauge to measure the magnesium ribbon more accurately. This would ensure that we had the same surface area on each magnesium piece. We could also use a stirring mechanism to ensure constant stirring. This would solve any problems we had with not being able to keep it constant by stirring manually e.g. tiring after stirring for a period.
To further this experiment we could maybe try doing different lengths of magnesium or change the surface area. This would enable us to see what happened if there was less or more surface area.