Variables:
There are many variables that I could use to test resistance, I had a choice of two variables: thicknesses or length, I chose to investigate the thickness of wires because I thought it would be more interesting. My independent variable is the thickness my dependant variable is resistance, another variable that I could use to test resistance is temperature but it wouldn’t be an accurate experiment due to equipment unavailability.
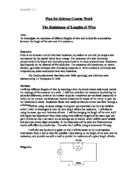
Fair Test:
To keep it a fair test I must keep the current (in amps) the same because it affects the resistance. I will also have to keep all the wires 25 cm, all the same length. I must use wires of the same material, Nickel Chromium. To make sure my results are accurate I will repeat my experiment.
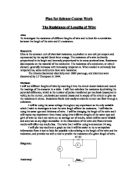
Prediction:
I predict that the thicker the wire the less resistance because the thicker
(greater diameter) the wire is the more electrons can flow through, for example the thicker a water pipe the more water can run through so therefore the less resistance.
Results:
Wire No. Diameter Voltage Current Resistance Length ¹/R D²
(S.W.G) (MM) (V) (A) (Ohms) (cm)
22 0.71 0.3 0.5 0.6 25 1.67 0.50
24 0.5 0.5 0.5 1 25 1 0.31
26 0.45 0.9 0.5 1.8 25 0.56 0.20
28 0.40 1.1 0.5 2.2 25 0.45 0.16
30 0.31 1.5 0.5 3.4 25 0.29 0.09
32 0.28 1.9 0.5 4.2 25 0.24 0.07
To work out the ¹/R column I had to divide each resistance by one.
To work out the D² column I had to times the diameter by itself.
Graph:
(There is a hand drawn, more accurate graph attached on the next page)
These are my second results:
Wire No. Diameter Voltage Current Resistance Length ¹/R D²
(S.W.G) (mm) (V) (A) (Ohms) (cm)
22 0.71 0.2 0.5 0.4 25 2.50 0.50
24 0.56 0.4 0.5 0.8 25 1.25 0.31
26 0.45 0.80 0.5 1.6 25 0.63 0.20
28 0.40 1.0 0.5 2.0 25 0.50 0.16
30 0.31 1.4 0.5 2.8 25 0.36 0.09
32 0.28 1.7 0.5 3.4 25 0.29 0.07
This is the graph for my second results:
(There is a hand drawn, more accurate graph attached on the next page)
Analysis:
My results show that the thicker the wire is the less resistance there is, therefore my prediction was correct. My results where not completely different so they are roughly accurate, however there was 1 anomalous result on my second graph so I could have made my experiment more accurate if I was more careful. I made both of my graphs positive by doing 1× resistance and for the diameter I did: Diameter ×Diameter (Diameter squared), by doing this the line of best fit turned from a negative correlation with a curved line of best fit, to a positive correlation with a straight line of best fit.
I think that I did enough tests to be certain of my conclusion.
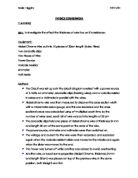
Evaluation:
My first results are slightly different to my second ones, I believe that my second results were more accurate because I had more time and I made sure that I kept everything under the fair test regulations while I was carrying out my second experiment.
The length of the wire could have affected my first results because the wire was curled up and it was hard to straighten it up, so it could have been a tiny bit bigger than 25 cm. As I was doing my second results I had more time and I was able to straighten up the wire as much as I could. My graphs have are positive correlation and a straight line of best fit. There were only a few anomalous results, which are not in a perfectly straight line, but they weren’t that much out, I made a third graph to compare my results and it shows my experiments are fairly accurate, but there was one anomalous result on my second results.
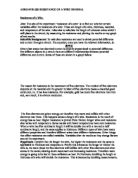
I measured the gradient (steepness of the line of best fit) on both of my graphs.
I used this formula to find the gradient: M=Y÷X
M= Gradient
Y = Dependant variable
X = Independent variable
The gradient on the first graph was slightly lower than the gradient on the second one, as the second one was higher.
I believe I carried out enough experiments to be certain that the thicker the wire is the less resistance thereof.