Prediction
I expect to find that the longer the wire, the greater the resistance this theory is re-enforced by information in my background. It is due to the fact that there will simply be more ions within a longer piece of wire than in a shorter piece, and collisions between electrons and ions create a resistance, so a longer strip with more ions, will have a higher resistance. To further this, when the wire’s length doubles, from my background information I know that, providing my wire’s temperature stays constant, the resistance will double in proportion. I know this because of Ohms law which states that ‘the electric current flowing through a conductor is directly proportional to the difference between its ends, temperature remaining constant.
Preliminary experiment
Plan
We are going to set up a circuit as shown:
We will do this circuit with 5 different voltages, as a matter of accuracy when drawing a line of best fit later on in graphs, necessary for a conclusion, and use both nichrome and constantan and see which has the least variety in average resistance, to ensure a more accurate experiment and conclusion, so that I know my results are reliable enough to draw information from them. The voltages will be determined by a volt meter, they will be 1,2,3,4 and 5, again, as a matter of accuracy in relation to graphs to be done later. These voltages will be used each time on different lengths, the shortest length we plan to use (40cms) and the longest (100 cms) The results will be determined by dividing voltage by current, to find the average resistance in ohms, and recording the results. Whichever has the least variety in resistance will be used in the main experiment for increased reliability and to draw more accurate conclusions, because with a piece of wire with hugely varied resistances, the results will be unreliable.
Preliminary results
100cm CONSTANTAN
V (voltage) I (current) R (resistance)
Amps Ω
6 0.70 8.57
5 0.58 8.62
4 0.46 8.69
3 0.35 8.57
2 0.23 8.69
100cm NICHROME
6 0.32 18.75
5 0.26 19.23
4 0.21 19.04
3 0.15 20.00
2 0.10 20.00
1 0.05 20.00
40 cm CONSTANTAN
5 1.43 3.49
4 1.13 3.53
3 0.86 3.48
2 0.57 3.50
1 0.28 3.57
40cm NICHROME
5 0.64 7.81
4 0.51 7.84
3 0.38 7.89
2 0.27 7.40
1 0.13 7.69
Analysis of preliminary
From the results of the preliminary experiment I can deduce that Constantan has the least varied results, and therefore the most reliable results, due to this I will use constantan rather than nichrome in my main experiment. According to ‘Science Data Book by R.M.Tennent’ constantan has a resistance of 8.29; we gained an average of 8.63, this was near, and so was another helpful point at which to base our nichrome/constantan decision on. We also saw the affects of leaving on the power supply whilst the results are being recorded, the wires did get very hot, very quickly, and so also needed changing for the main experiment.
Main experiment
Safety
Ensure that wires do not over heat.
Do not pull on the wires as they can cut through the skin.
Do not spill liquids on the equipment.
Plan
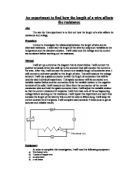
For the main experiment I will set up the apparatus in the same way to the preliminary (shown in diagram). I will use constantan for reasons previously explained. I will also, for a more accurate and reliable set of results, use five voltages for each length.
Set the required length, starting with the longest first so as to reduce the risk of over heating or burning out the wire and ruin the experiment. The longest wire is 100cm, the measurements go down 20 cms each time, until 40cm wire is reached. Set the volt according to the volt meter, not using the in built variable resistor on the power supply, for accuracy. Switch on the circuit and take note of the current from the ammeter. Find out the resistance by dividing the voltage by the current, make note of the resistance, add all the resistances for each length, divide by five (the number of voltage readings taken), this gives you an average resistance for each length, which will help analyse later on when drawing graphs etc.
Main experiment results
40 cm
V I R
Volts Amps Ω
5 1.40 3.57
4 1.10 3.63 - Average resistance = 3.61
3 0.84 3.57
2 0.56 3.57
1 0.27 3.70
50cm
V I R
5 1.13 4.42
4 0.91 4.39 - Average resistance = 4.47
3 0.67 4.47
2 0.44 4.54
1 0.22 4.54
60cm
V I R
5 0.93 5.37
4 0.75 5.33 - Average resistance = 5.45
3 0.55 5.45
2 0.36 5.55
1 0.18 5.55
70cm
V I R
5 0.79 6.32
4 0.63 6.34 - Average resistance = 6.35
3 0.47 6.38
2 0.31 6.45
1 0.16 6.25
80cm
V I R
5 0.72 6.94
4 0.56 7.14 - Average resistance = 7.10
3 0.42 7.14
2 0.28 7.14
1 0.14 7.14
90cm
V I R
5 0.63 7.93
4 0.50 8.00 - Average resistance = 8.07
3 0.37 8.10
2 0.25 8.00
1 0.12 8.33
100cm
V I R
5 0.55 9.09
4 0.44 9.09 - Average resistance = 9.09
3 0.33 9.09
2 0.22 9.09
1 0.11 9.09
90 8.07
100 9.09
Conclusion
The evidence shows that when I increase the length, the resistance increases proportionally. I can tell this from my results because the graph shows a very accurate line of best fit, with many of my points resting on it.
I think that my results reflect and support my prediction well. I can see that, for example when doubling 20 cm (40cm) wire I also double the voltage, from 1.7V to 3.5V. Direct proportion is clearly apparent, which reflects Ohm’s law, which states, so long as temperature is constant – voltage and current are proportional, this is shown in the second of my two graphs, with almost all points laying on the lines of best fits. My plotted points lay either on or extremely close to the line of best fit, so this shows an accurate set of results. So in conclusion the evidence has shown that this was an Ohmic conductor, my prediction was accurate, there is an obvious trend, displayed by the line of best fit laying on many of the points. These results reflect that the wire I used was an ‘ohmic conductor’. They also show the relation between wire length, and resistance, which is the aim to find. It shows that a doubling of length in wire (in this experiment) gives a doubling in resistance.
Evaluation
I am very pleased with the high level of accuracy of my results, especially for the 100cm length at which all resistances were the same. The points on my graph almost all lay on the line of best fit, which displays a high level of accuracy – which is helpful to draw a reliable conclusion, with no particularly anomalous results. For accuracy I used six different measurements, and didn’t have to repeat any of them. I took into account needing to allow the wire to cool, by turning off the power whilst taking readings, and keeping the cross sectional area constant. We maintained this using a 32 s.w.g. each time. Another factor to take into consideration was the angle at which the crocodile clips intercepted the constantan wire; we maintained this as a 90 degree angle, as it is the easiest to repeat. To investigate further into this experiment I could use different wires materials at different lengths and see if similar patterns and rules apply. If I was repeating this experiment altering one factor I think I would have used a wider range of wire lengths, to get a more accurate and detailed conclusion. I would also ensure that the crocodile clips have been connected to the wire at 90 degree angles each time, I think this was done, but it wasn’t something we regularly checked.
-Stefan Nagorski -