As in my aim: I had already decided that I wanted to obtain the minimum of five readings so I could draw up at least some conclusions. Otherwise the investigation would be pointless because my analysis and evaluation would be based on my own assumptions. My preliminary work shows that only being able to take readings for three different concentrations will mean when carrying out the proper practical, where everything will be planned, I will still only be able to take readings for the maximum of five different concentrations. In the preliminary experiment I chose the different concentrations as follows: 0.2 molar, 0.4molar and 0.6molar. However, I thought that it would be better to have the different concentrations such as 0molar, 0.25molar, 0.5molar, 0.75molar and 1 molar. This was because I only wanted five readings and not six. If my concentrations were increasing by 0.2 molar each time I would have six readings, which I would not have, been able to carry out in the limited time allocated to carry out the experiment.
I also found that when doing the actual experiment I would have to use the same cross and makes sure that it did not fade. In the preliminary experiment I had to keep changing the piece of paper the cross was on because water and acid and the thiosulphate sometimes spilt on it and faded the cross making it lighter and lighter and therefore the rate of reaction in some places increased when actually it was meant to decrease. Therefore I have decided that I will laminate a piece of paper with a clear black cross-marked on it hence making the real experiment fair.
Control Variables
I need to explain how and why I kept key variables other than hydrochloric concentration constant.
Temperature: An increase in temperature is accompanied by an increase in the reaction rate. Temperature is a measure of the kinetic energy, so higher temperature means higher average kinetic energy of molecules and more collisions per unit time. In simple terms a higher temperature causes more useful collisions plus more energetic collisions. In this experiment I will try to keep the solution at a constant temperature. Although I cannot control this entirely I will do my best to make sure that the temperature is roughly the same. The temperature I will use will be room temperature about 20ºC. To prevent any change in room temperature all windows will be closed, air conditioning will be switched off and no bunsen burners will be used in the laboratory during the experiment. To keep the temperature constant I will use a thermometer and check the room temperature every so often.
Concentration of Sodium Thiosulphate:
Sodium thiosulphate = 158g Na2S2O3 (46 + 64 +48= 158)
One mole of sodium thiosulphate is 158g of sodium thiosulphate. One molar solution of sodium thiosulphate would contain 158g of sodium thiosulphate dissolved in 1dm³ of water (the solvent). I will use 40g/dm³ of sodium thiosulphate, which is not an S.I unit of concentration, but it does not matter as long as the concentration is kept constant. I need to keep the concentration of sodium thiosulphate constant because changes in the concentration of sodium thiosulphate will affect the collision rate and reaction rate. The higher the concentration of sodium thiosulphate will result in more useful collisions increasing the rate of reaction.
Volume: The volume of thiosulphate also needs to be kept constant. This will be kept by measuring 50cm³ for each experiment including repeat experiments from the same “reservoir”. Using the same volume for each experiment would ensure a fair test. Increased volume would result in more sodium thiosulphate molecules and therefore more useful collisions and increased rate of reaction.
Pressure: The pressure of the reaction flask is unlikely to affect the reaction rate because I am not dealing with reactions between gases. The experiment is to be carried out at atmospheric pressure, which can be considered not to change in time.
Risk Assessment
- Goggles to protect the eyes from chemicals: - hydrochloric is corrosive
- Spillages of chemicals must be reported to the tutor and dealt with safely.
- Any skin contact with chemicals used in the experiment must be dealt by rinsing with cold water from a running tap.
- Laboratory coat must be worn at all times.
- No loose hair or clothing in the laboratory
- Glass apparatus must be handled with care. Any breakages must be disposed safely.
- Sulphur dioxide is a pungent gas and can affect fellow students or the tutor!, in the laboratory particularly someone who suffers from asthma. I used cotton wool rolls to prevent escape of sulphur dioxide from the reactant flask.
- Stand at all times during the experiment to prevent tripping over.
- At the end of the experiment dispose all the chemicals safely.
Apparatus and Materials
Materials
- 750cm³ of sodium thiosulphate
- 60cm³ of hydrochloric acid (0.5molar solution)
- 40cm³ of distilled water
- Laboratory Coat
- Safety spectacles
- Pen
- Paper with a record table to write down results
- A Sink (to spill solution down when result is recorded)
- Some paper towels (to wipe spillages)
- Laminated paper with a black cross in the centre
Apparatus
- A 150cm³ conical flask
- A 50cm³ measuring cylinder
- A 25cm³ measuring cylinder
- A 5cm³ measuring cylinder
- Stopwatch
- 2 Pipettes
- Thermometer
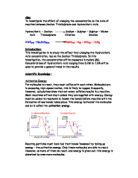
Method
- Prepare my attire by putting on a laboratory coat and safety goggles and tie back loose hair safely. Make sure that you prepare a table to write down your results and have near a pen to do so.
- Gather all the apparatus and the materials and keep them so that they can be used in a systematic way during the experiments. The main containers of sodium thiosulphate a hydrochloric acid were labelled to avoid mix up. The distilled water was made available in a blue container (for identification) with a dispenser.
- Place the laminated cross (pre-prepared using the computer) on the table. The same cross will be used for all the experiments ensure a fair test.
- Place a 150cm³ conical flask on the laminated paper with the cross. Pour 50 cm³ of sodium thiosulphate into the 50 cm³ measuring cylinder. To make sure the reading is accurate bend your knees to the ground so that your eyes are in line with the measuring cylinder and make sure the measuring cylinder read 50 cm³. It is important that no hydrochloric acid gets into this cylinder or else the reaction will start in the cylinder. If there is too much or too less sodium thiosulphate use a pipette to add or take away some sodium thiosulphate. Then pour into the conical flask this 50 cm³ of sodium thiosulphate.
- In 20-cm³ cylinder pour 20 cm³ of concentrated hydrochloric acid (look at the table below for volumes to change HCl concentration). Bend my knees so that my eyes are in line with the measuring cylinder and makes sure the reading is correct. If there is too much or too less hydrochloric acid use a separate pipette to the one used for sodium thiosulphate to take away or add more hydrochloric acid. It is important to keep this measuring cylinder only for the hydrochloric acid as a reaction may otherwise occur. Make sure that the pipettes are not mixed up as this may affect the results.
- Now pour this 20 cm³ of concentrated hydrochloric acid into the conical flask and simultaneously start the stopwatch. Also place a roll of cotton wool to stop the sulphur dioxide from getting into the air.
- Swirl the conical flask round five times for each experiment to ensure a fair test.
- Stop the stopwatch when the solution inside the conical flask becomes opaque and you cannot see the cross.
- Record your result.
- For each concentration of hydrochloric acid the experiment is done three times so that for each concentration of hydrochloric acid one has three sets of readings. Average results can be calculated later and entered in the last table.
Accuracy and Other Variables
I need to explain the measures taken to eliminate inaccuracies.
I have to record all Volumes accurately (eye level with the bottom of the meniscus on the line).
We have to record all Times accurately (start reading as soon as the hydrochloric acid enters the flask).
But judging when the black cross is obliterated from view is subjective.
So taking three readings and eliminating any that stand out “anomalies” is how I will try to achieve reliability.
I will repeat readings until three are close in value. I will be more confident in my results if they are consistent.
The same person must take the reading, as different people will judge differently when the “X” disappears.
The position from which I observe must be the same for each experiment.
The number of times I must swirl the conical flask must also be kept constant for all experiments as it makes the results more reliable and accurate.
The rate at which the acid is added to the sodium thiosulphate should be constant. This means that it should always take the same amount of time to add the acid to the sodium thiosulphate.
RESULTS TABLE TO SHOW THE EFFECT OF HYDROCHLORIC ACID CONCENTRATION ON THE RATE OF THE REACTION BETWEEN HYDROCHLORIC ACID AND SODIUM THIOSULPHATE
The data are given to the nearest whole number because data can never be this accurate. This is due to the time it takes me to start and stop the stopwatch. We call this my reaction time. Therefore I say that the data are given to the nearest whole number due to my reaction time.
What are error bars and what do they show for this experiment?
When plotting points on a graph, the uncertainty is included in the form of “error bars’’, which look the bars drawn on the graph showing the concentration of hydrochloric acid against the average time taken for the black cross to disappear. Two examples of error bars are shown below:
The long error bars mean that the evidence gained is not very reliable as the data is very spread and the short error bars show that the data is quite reliable because all the readings are very close together.
Observation 1 (relationship between the concentration of hydrochloric acid and the average time taken for the solution to become opaque and hide the cross)
The results table shows that as the concentration of hydrochloric acid increases the time taken for the black cross also decreases, but does not decrease in proportion.
Observation 2 (relationship between the concentration of hydrochloric acid and the rate of reaction
The show that as the concentration of hydrochloric acid increases the rate of reaction increases proportionately.
Analysis and Considering Evidence
Previously in Section P: Planning, I said in prediction:
Prediction
I predicted that the rate of reaction above would increase as the concentration of hydrochloric acid increases. This would be indicated by the increased rate at which the solid sulphur is produced and the solution becomes opaque.
I also predicted that as the concentration of hydrochloric acid increases the average time taken for the laminated, black cross to disappear would decrease. I can explain my prediction with the collision theory.
The “collision theory” states that if there are more particles of a fixed amount of substance i.e. a higher concentration the particles are more likely to collide with each other then they would be in a less concentrated solution. The diagram below illustrates this.
So as I increase the concentration of hydrochloric acid, the number of collisions with the sodium thiosulphate particles increase and hence the rate of reaction increases and less time is taken for cross to be covered.
Graph 2 also show the same data as graph one, however, the line of best fit is a straight line unlike the curve of best fit on Graph 1. At first I questioned my data as to whether I has sufficient information to draw a curve of best fit. Could my line of best fit be a straight line? So I decided to draw a line of best fit. When I drew the line of best fit and compared it to the graph with the curve of best fit I realised that the curve of best fit represented my data far better that the graph with the straight line of best fit. This was because of the big percentage error of 14.6% at a concentration of 0.25 moles of hydrochloric acid. Therefore I will be analysing Graph 1 as Graph 2.
Graph 1 shows that as the hydrochloric acid concentration increases the time taken for the sulphur to form (the cross to become obliterated from view) decreases. The shape of the graph shows this and also at the 1 molar concentration of hydrochloric acid the time taken for the cross to disappear is at an average 31 seconds and at a lesser concentration of 0.25% concentration of hydrochloric acid the average reading is 65 seconds. The decrease in time can be explained by the collision theory, which states that if there are more particles of a fixed amount of substance i.e. at a higher concentration the particles are more likely to collide with one another then they would be in a less concentrated solution. The diagram below illustrates this:
Graph 3 shows the concentration of hydrochloric acid against the rate of reaction. I did not have to draw to lines of best fit, as my data clearly showed a straight line. In my prediction I said that the rate of reaction would increase proportionately as the concentration of hydrochloric acid increased.
My line of best fit agrees with my prediction. However I have one anomaly and perhaps this is because my reaction was a little slow. I will discuss this further in my Evaluation.
Evaluation
On graph 1 I have drawn error bars. As discussed in Section O: Observation, when plotting points on a graph, the uncertainty is included in the from of “error bars”, which look the bars drawn on the graph showing the concentration of hydrochloric acid against the average time taken for the black cross to disappear. Error bars show the reliability of data.
The error bars on Graph 1 show that my data is quite reliable. The most unreliable data on the graph is the error bar drawn for the concentration of hydrochloric acid of 0.25. The error bar drawn for concentration of hydrochloric acid of 0.75 shows that it was the most reliable because all the readings gave the same results. Overall my error bars show that my results are very reliable because all four data pass through my curve of best fit and there are no percentage errors.
Although my results were quite reliable it would have helped to have more readings so I could draw more conclusions however, the time limit was a problem and only allowed me to collect data for five different hydrochloric acid concentrations. If I repeated the experiment I would have a wider range of concentrations so that my results were even more reliable and so I could conclude more from my results. The range would be 0.0, 0.1, 0.2, 0.3…0.8, 0.9, 1.0M.
On graph three, I discussed earlier that there was an anomaly as highlighted on the graph. It did not fit in with the line of best fit I drew on the graph. This could be due to several reasons, however; I think it was most likely down to my reaction time when stopping the stopwatch was a little fast. There is no practical way of controlling this, as it is how fast my reaction takes place when seeing the cross disappear.
It could be due to inaccuracy when reading volumes. Perhaps I misread this meniscus line and there was too little volume of the solution measured. It would be better if I made sure that my eye was level with the meniscus line and making sure that using modern technology such as electronic pipettes/ syringes to excrete the exact amount of volume of the solutions.
Overall I think that my investigation has been a fair success!