1 clamp stand
4 clamps
Wooden test tube rack
5 thermometers
2 beakers
5 rubber bands
Stopwatch
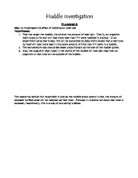
Initial Investigation
Firstly, we will take two boiling tubes and wrap one sheet of kitchen towel around each, covering the whole test tube and using a rubber band to secure the kitchen towel. We will secure them to either side of a clamp stand using clamps, and place a large beaker under each, to try to eliminate any spillage caused by the experiment. We will fill a beaker with tap water and make sure the water temperature is 25°C. We will then get a kettle and boil some water. When it has boiled, we will pour the water into a beaker, and wait until it has cooled down to 65°C. Then, we will use a 20cm3 syringe to measure 20cm3 of water into each boiling tube. We will use a funnel to make sure we do not spill the water. We will put a thermometer into each tube and using the water with a temperature of 25°C, we will measure 2cm3 using another syringe, and squirt it around the kitchen towel surrounding the boiling tube to represent the sweat. We will then measure 8cm3 using the same syringe, and immediately start the stopwatch. We will record the temperature of each boiling tube every 30 seconds for 10 minutes.
The reason for us using a temperature of 25°C for the sweat is that this is approximately room temperature, which is what we presume the temperature of sweat to be. We used 65°C inside the boiling tube, so that there would be a wide temperature difference, making our results more accurate and easy to understand. We used 2cm3 and 8cm3 for the amount of sweat, as they represented our maximum and minimum values for the sweat, and we needed to make sure both worked, so that all the others would work.
Results
Time
Time
From our results, we can immediately see that the boiling tube with more ‘sweat’ lost heat more quickly, so we can tell that our experiment should work, and my prediction was fairly accurate.
However, we found a few problems with our initial investigation. Firstly, we need to record the starting temperature more accurately. When we first put the water from the kettle into the beaker it was 90°C. By the time it was in the boiling tube, we measured it and it was 65°C. Secondly, we needed to use larger beakers to catch the drips, as it made more mess than we thought it would. We also think that we should have used 30cm3 of water in each boiling tube rather than 20cm³, as 20cm³ only takes up about ¼ of the boiling tube. We thought that the more water inside the test tube, the more convection would occur, so our results would be more realistic. Lastly, we thought we could add another test tube to the experiment, but one without any sweat added to it – acting as our control boiling tube.
Method
Firstly, we will take the 10 boiling tubes and wrap one sheet of kitchen towel around each. We will make sure the kitchen towel covers the whole of the tube, and we will use a rubber band to secure it. We will then place one of those boiling tubes into a wooden test tube rack. This will be our control test tube. We will then clamp 4 of the remaining boiling tubes to a clamp stand, each facing north, south, east and west – so that no drips fall onto any tubes, which could affect our results. We will then boil the kettle, and fill one beaker with water with a temperature of 25°C while we wait for it to boil. When it has boiled, we will pour it into another beaker, without recording the temperature. We will then take 5 small funnels, and push a hole through the kitchen towel, covering the top of the 5 test tubes. We will then use the syringe to measure 30cm³ of hot water into each tube, and we will then place a thermometer in each one. We will then measure 2cm³, 4cm³, 6cm³ and 8cm³ of water using the other 20cm³ syringe, and very carefully squirt the water around the top of the 4 boiling tubes on the clamp stand. We will immediately record the start temperature of each of the 5 test tubes, and start the stopwatch. The temperature of each tube will be taken every 30 seconds for 10 minutes. After we have recorded our results, we will repeat the experiment as soon as possible, using the remaining 5 boiling tubes.
Results
Attempt 1
Time
Time
The blank column displayed after 4 minutes shows the time when we missed recording our results.
After our first attempt at this experiment, we realised that recording the results of 5 different boiling tubes every 30 seconds was very difficult, and could lead to mistakes being made very easily. For our second attempt, we then decided to record results every minute, so as to make our results more accurate.
Attempt 2
Time
Time
I will now take an average of the 2 sets of results for every minute, to improve the inaccuracy of the results.
Average
Time
Time
From the average set of results, I can see that they look quite accurate, and have mostly proved my prediction right. The finishing temperature rises as the volume of sweat decreases.
I had to take an average, as some of the results on both experiments looked quite inaccurate - they did not follow the pattern.
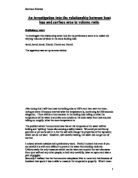
A graph to show the effect of the volume of sweat on heat loss.
Conclusion
From my results, we can see that my prediction was right. The graph clearly shows that the boiling tubes with a higher volume of sweat lost heat more quickly. This happens because the more volume of sweat on the boiling tube, the more energy required for it to evaporate, as there is a larger quantity. The sweat then draws the appropriate amount of heat energy from the water inside the boiling tube (representing your body), which therefore cools it down quicker than those with less sweat.
Evaluation
I think my results were reasonably accurate, but we did have a few problems. We had planned for the water in the boiling tubes to be at the same starting temperature of 60°C. We decided to do this in order to allow a large gap before the water reached room temperature. This would enable us to gather a wider set of results, which would hopefully improve our accuracy overall. However, after all the tubes had been filled with boiling water, some took longer to reach 60°C than others. This was probably because the water that we had poured in certain boiling tubes first became in contact with the cool air first, and so began cooling down before the others. So we started when all of the temperatures were around 60°C, and then took all of the results. We then adjusted our results to get them all to start at 60°C. For example, the boiling tube with 8cm³ of water in started at 58°C, so we added 2 to all of the results for that boiling tube.
However, this could be a problem, as when the temperature is higher, it will tend to lose heat quicker, making our results inaccurate.
We can see on the graph that at 4 minutes, there is a slight rise in the temperature of all of the boiling tubes. This was probably because we only got one set of results for 4 minutes. On the first attempt, we missed the time as we were finding it difficult to keep up. So on the graph, the results plotted for 4 minutes are just the results of the second attempt.
During the experiment, we noticed that the ‘sweat’ occasionally dripped off of each boiling tube. This is obviously a small problem, as it affects the amount of sweat actually present on the ‘skin’. For example, the boiling tube with 8cm³ of sweat could end up only having 6cm³. To improve this, we could have measured the sweat that had fallen into the beakers we had placed under the boiling tubes. Then we could have worked out exactly how much sweat had been on the boiling tube throughout the experiment,