Input - Light intensity is to be varied by increasing and decreasing the distance from the light source to the plant
Output - The rate of photosynthesis is to be measured by counting the bubbles of oxygen produced by the plant every two minutes, and therefore finding the rate of photosynthesis
Control – The amount of water available to the Elodea will stay the same level in the 400 cm3 beaker. The colour of the lamp will stay the same (yellow) as to plants Chlorophyll easily absorbs blue light, however it does not easily absorb green or yellow light, rather it reflects it, this decrease’s the rate of photosynthesis. This can easily be controlled, simply by using the same lamp throughout the experiment. Finally the temperature will stay the same which was at room temperature 21 0c. I will check the temperature frequently, in case the heat given off from the lamp should slightly raise the temperature.
Method
Apparatus used
Desk lamp
Simon Cooke L5D
Elodea pond weed
Beaker
Test tube
Ruler
Thermometer
Knife
Cold water from tap
Stop watch
Funnel
The apparatus was set up as below:
Elodea that was kept well illuminated in a lab was taken for this experiment. The stem of the Elodea was cut with a scalpel at an angle, and then a 400 cm3 beaker was filled with tap water. A funnel was the placed at the bottom of the beaker with the pond weed inside the funnel with the cut end placed up the tube of the funnel. A test tube filled with water was then placed over the top the top of the funnel, a thermometer was also placed in the water while the experiment was taking place so that the temperature could be checked to see how hot the water was. Then the lab blinds were pulled down so that no light could come from the windows and the lights were turned off. A desk lamp was set up facing the Elodea, a meter ruler laid along side the lamp so that the distance could be measured. A stop clock was set and the numbers of bubbles were recorded down. Each distance was done twice so you had some results that you could compare against each other. Then every two minutes the lamp was moved back 5 cm each time and then left for two minutes and once again the results were recorded down.
Prediction
I predict that the higher the light intensity increases, so will photosynthesis. The lower the light intensity the slower the rate of photosynthesis and eventually it will decrease in l
Simon Cooke L5D
level. Though eventually how ever high the height intensity is the rate of photosynthesis will level off.
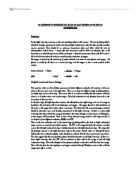
Results
Analysis
My graph shows that the closer the distances of the light source the higher the rate of photosynthesis. This is because photosynthesis is a reaction and reactions need energy and it this gets from light. The more light there is the more energy the reaction gets and this speed’s up the whole process of photosynthesis. This can be seen on the graph as the highest point this is where the Elodea is photosynthesizing at a high rate and it starts to slowly drop as the distance is increasing. The graph goes from a slow decent to all of a sudden it drops and keeps on falling until the results end at a distance of 20 cm and a number of 153 bubbles in those two minutes. The second results follow the same pattern with a slight difference by of one or two bubbles every two minutes. The only considerably difference is the last point on the graph of the second results and the number of bubbles was 148 there is quite a difference between the 148 and 153. My graph has no anomalies, and it closely followed to what I had predicted that the closer the distance of the light the higher the rate of photosynthesis would be and thus produce more bubbles in the time recorded. The only thing which did not fit my prediction was that the graph did not level off, however I believe this did not happen as I did not have enough time to record any more results. If I did have more time and had extra distances then I believe that the graph would have leveled off and come out of such a steep fall. I can say that the increase in distance thus making the light intensity stronger increased the rate of photosynthesis and when further away made the rate of photosynthesis almost come to its limiting factor the straitening of the graph.
Simon Cooke L5D
Evaluation
I am happy how my experiment turned out, I do think though there were many points at which the accuracy was not perfect in the experiment. For instance working out the distance between the lamp and the beaker holding the Elodea, as the lamp had a cover a
round the bulb which meant it was hard to measure the exact distance as the cover restricted your measurement. If I repeated the experiment I would use a lamp with out a cover around it. Also I would make the time you counted the bubbles in longer possibly by another minute and a half, as two minutes are not a long enough time to fully see photosynthesis at its best. I would also give my self a longer time to do the experiment in so I could get an even more reliable graph with a limiting factor which could back up my evidence of photosynthesis. I would be more prepare next time so that I could get ready the apparatus more quickly and get on with the experiment, I would finally have left a gap of time between when the lamp was moved to a new distance and the recording of the bubbles began so that the Elodea could adapt to the new changes before running straight on with the next set of the results. I am happy with the experiment as I proved that light intensity has an effect on the rate of photosynthesis. I have a reliable set of results and graph with no anomalies my experiment had a low error percentage.