The two stages reflect the literal meaning of the term photosynthesis, to build with light. The experiment should produce a certain shape when the results are plotted onto a graph. This is shown on the diagram below.
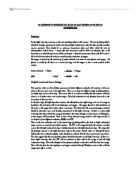
Graph to show the predicted rate of reaction of photosynthesis against the Light Intensity
There are many other factors which affect the rate of photosynthesis. The graph is a positive straight line because there is only the light intensity which will affect the rate of reaction. Nearer the top of the graph, the line begins to flatten off because this is where another limiting factor begins to affect the experiment. This may be the level of carbon dioxide in the water or it may the temperature of the water. This could affect the results because if the plant can only take in a limited amount of carbon dioxide then the plant will not be able to photosynthesise as quickly.
(‘Microsoft Encarta 98’ CD-ROM, Biology ‘A functional Approach’ by M B V Roberts, ‘Understanding Biology for Advanced Level’ by Glenn and Susan Toole and ‘Essentials of Plant Physiology’ by G. A. Strafford)
The two stages of photosynthesis and their functions
(Biology ‘A functional Approach’ by M B V Roberts)
Method
Trial
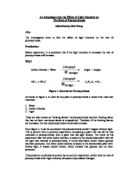
First I set up all of the apparatus as shown in the diagram below. I decided to set the lamp at 135cm away from the shoot of Elodea in the apparatus. The oxygen produced by the plant through photosynthesis was measured by measuring the length of the oxygen bubble in the capillary tubing along the scale. The water with the Elodea was set at temperature of 25oC.
I left the plant for two minutes to give it time to acclimatise to the new light intensity and water temperature. I then turned the light on and left the plant for five minutes. The total amount of gas given off was measured as the pipe containing the oxygen produced was next to a scale measured in millimetres.
The total amount of gas given off was gave insufficient values of Oxygen to measure so I decided that next time, I would leave the plant five minutes to acclimatise to the new light intensities and two minutes to measure the amount of gas given off.
Apparatus & Equipment:
Clamp stand, syringe, plastic tubing, capillary tubing, thermometer, glass beaker, scale in mm, test tube, water bath, Elodea shoot (10cm), Potassium Bicarbonate solution, lamp. This equipment is used to set up Audus’s Apparatus.
- Set up the apparatus in accordance with the diagram below
-
Bring the temperature of the water bath to 30oC.
-
Place the plant in the test tube in a controlled solution of potassium bicarbonate to keep the CO2 level constant. This is one of the limiting factors of photosynthesis and so it must be kept the same so that it is a fair test. So that the carbon dioxide levels are kept constant throughout the experiments, both the water and the potassium bicarbonate will be replaced for each of the different light intensities. This should keep the level of carbon dioxide and other substances in the water constant. This should also help keep the pH of the water the same for each of the experiments. The pH level of the water will also affect the rate of photosynthesis so this also needs to be kept constant. The test tube is sealed with exit only via the capillary tubing and thus past the scale.
- Another variable that needs to be kept constant is that the same plant is needs to be used for each of the experiments. Also, the temperature of the water around the plant needs to be kept the same. This should give the chlorophyll the optimum conditions at which it can convert the light into energy and therefore make the plant produce the most oxygen.
-
Place the light at 135cm from the beaker and leave for 5 minutes to acclimatise to this light intensity; the plant in the trial did not have enough time to acclimatise properly in 2 minutes. Check that the temperature has not changed from 30oC and add hot or cold water to the beaker if necessary to adjust.
- Measure the volume of gas produced in 2 minutes.
- Repeat twice more to ensure an accurate result and to eliminate errors, then take the mean readings of the three.
- Move the light to a distance of 148cm and repeat steps 1 – 7 above.
- Move the light to distances of 191cm, 230cm, and 330cm and repeat steps 1 – 7 above for each distance.
Table of Results
To find out what the light intensity was at each of the distances I used the formulae shown above the table. This is the factor I compared the total distance of the oxygen bubble to.
Conclusion
The graph shows that there is a direct correlation between the light intensity and the amount of oxygen produced through photosynthesis in a plant. This correlation is due to the way that the plant uses water and carbon dioxide to create glucose which it needs for respiration. When the plant breaks down the water, through Photolysis, there is oxygen left over. This is the oxygen that is released through the leaves. As light is needed for the reaction to take place, then the amount of light should affect the amount of oxygen left over.
On the graph, the x-axis shows the light intensity at each of the distances and the y-axis shows the length of the oxygen bubble that was created at each of these different light intensities. The best-fit line shows the correlation between the two as it lies along the line created by most of the points. This shows there to be a direct correlation between the results.
As there is a direct correlation, the gradient of the graph at each of the different points should be around the same amount. So that it is easier to find the gradient, I scaled up the light intensity by a factor of 100,000. To find the ratio between the two factors, I did the equation of:
Length of the oxygen bubble (mm)
Light intensity (lux) (scaled up by factor 100,000)
Most of these results do have about the same ratio between them and this proves that there is a correlation between the light intensity and the rate of photosynthesis. This backs-up what is shown on the graph as this also showed there to be a correlation between the two factors. The only result that was a long way off the average gradient and this is where the distance of the light from the plant as 191cm. This is also shown on the graph as a long way from the best-fit line and it is circled. This may have happened because the light surrounding the apparatus was not controlled properly. If the amount of light had changed then this would have affected the results.
This correlation is due to the reaction between the different molecules to produce glucose, which is needed to give the plant energy.
The equation for photosynthesis is:
Carbon Dioxide + Water Glucose + Oxygen
6C02 + 6H20 C6H12O6 + 602
The reaction that takes place inside the plant cells to produce glucose, and therefore oxygen, actually happens in two stages. The first stage, the light-dependant stage, produces the energy and molecules for the second stage. This stage uses light to split water into hydrogen and oxygen in the process known as Photolysis. The oxygen is usually no longer needed after this and so it becomes a waste product. If there is oxygen being given out then this means that the rate of photosynthesis is faster than that of respiration. This is the oxygen which is later expelled from the plant through transpiration. These reactions also produce ATP, which is the store of chemical energy needed to drive the next stage, the light independent stage. This stage takes the oxygen from the light dependent stage and adds it to the carbon dioxide taken in through the leaves. This forms the basic chain of elements which is needed to create glucose.
These two stages are essential if the plant is to produce enough energy, in the form of glucose, to survive and reproduce.
In this section, I used ‘Nuffield co-ordinated Sciences Biology’, ‘Microsoft Encarta 98’ CD-ROM, Biology ‘A functional Approach’ by M B V Roberts, ‘Understanding Biology for Advanced Level’ by Glenn and Susan Toole and ‘Essentials of Plant Physiology’ by G. A. Strafford to gain my information.
Evaluation
The experiment went well because the results showed a direct correlation between the light intensity and the rate of photosynthesis. This backs up the prediction that I made earlier by showing conclusive evidence that the rate of photosynthesis is directly related to light intensity.
The only anomalous result is that of when the light was 191cm away from the plant. On the graph this result is circled, as it is a long way from the best-fit line. This may have happened because the light in the room was not controlled properly. If there were any other light falling upon the plant then this would have changed the light intensity and the amount of oxygen produced through photosynthesis. This error could also have occurred if the temperature of the water was not kept constant. As temperature is one of the limiting factors of photosynthesis, this could have affected the results if it was not kept constant.
The experiment could be improved because during the experiment there was a lot of other light falling upon the plant. This came from both the overhead lights and the light coming in through the window. To eliminate this problem, the test tube could be covered in a layer of foil which would stop any other light from reaching the plant. There would be a gap in the foil to let the light from the lamp to hit the plant.
Also, the ambient temperature of the water and air surrounding the plant and capillary tubing may have changed. As a gas’s volume will expand in higher temperatures and contract in lower ones, then this could have altered the results. The length of the oxygen bubble would have changed along with the temperature around it. The reading would show there to be a different amount of the gas than there actually was. To solve this, the apparatus could be placed in a thermostatically controlled water bath. This would control the ambient temperature around the apparatus and therefore the temperature of the oxygen bubble
To extend the experiment, I could use different plants to see if there is a correlation between the light intensity and the rate of photosynthesis for other plants including land plants. I could also aerate the water around the plant so there is a constant supply of carbon dioxide in the water for the plant to use during photosynthesis. Aerating the water would also prevent any oxygen being lost by dissolving into the water.
To keep the same amount of minerals available for each test, I would also have to change the water each time. The plant needs the minerals to grow and to produce the chloroplasts needed for photosynthesis. The main mineral needed for this is magnesium so this would have to be very carefully controlled in order to keep all of the variables constant.
I could also measure the amount of gas produced more accurately by measuring the mass of the gas produced. To do this, I would have to measure the mass of the apparatus before the experiment and after the experiment. The water inside the apparatus could not be changed between weighing, as this would change the results. The mass would have to be measured to a very high accuracy because the mass of a gas is so small. This would have to be used on a land plant, as it would be very difficult to measure the correct mass of a water plant. Water is constantly moving through the plant and so the mass would be constantly changing.