The diameter of conductors used in electronics is often only a fraction of an inch, therefore, the diameter is expressed in mils (thousandths of an inch). It is also standard practice to assign the unit circular mil to the cross-sectional area of the conductor. The circular mil is found by squaring the diameter when the diameter is expressed in mils. Thus, if the diameter is 35 mils (0.035 inch), the circular mil area is equal to1225 circular mils. A comparison between a square mil and a circular mil is illustrated in figure 4.
I will keep the cross-sectional area of the wire the same by using a single piece of wire for the experiment.
-
Material - a nichrome wire has more resistance than a copper wire of the same size.
Electric current is the movement of electrons through a conductor. In this experiment a metal wire (Nichrome will be the conductor). So when resistance is high, conductivity is low. Metals such as Nichrome conduct electricity well because the atoms in them do not hold on to their electrons very well. Free electrons are created, which carry a negative charge, to jump along the lines of atoms in a wire, which are in a lattice structure. Resistance is when these electrons which flow towards the positive collide with other atoms, they transfer some of their kinetic energy. This transfer on collision is what causes resistance.
Resistance refers to a material's opposition to the passage of electric charges through it. Resistance occurs when electrons moving in the material collide with atoms and give up energy. The energy the electrons give up is converted into heat. A good conductor, such as copper, has low resistance. The semiconductor silicon has higher resistance. Insulators, such as glass or wood, have such high resistance that it is nearly impossible for electric charges to flow through them. Superconductors offer no resistance to the flow of electric charges. Resistance depends not only on the type of material but also on its size and shape. For example, a thin copper wire has more resistance than a thick one. A long wire has greater resistance than a short one. A material's resistance may also vary with temperature.
-
Temperature for metal conductors, resistance increases with temperature. For semiconductors, it decreases with temperature.
Temperature changes affect the resistance of materials in different ways. In some materials an increase in temperature causes an increase in resistance, whereas in others, an increase in temperature causes a decrease in resistance. The amount of change of resistance per unit change in temperature is known as the temperature coefficient. If for an increase in temperature the resistance of a material increases, it is said to have a positive temperature coefficient. A material whose resistance decreases with an increase in temperature has a negative temperature coefficient. Most conductors used in electronic applications have a positive temperature coefficient. However, carbon, a frequently used material, is a substance having a negative temperature coefficient. Several materials, such as the alloys constantan and manganin, are considered to have a zero temperature coefficient because their resistance remains relatively constant for changes in temperature
Resistance thermometers indicate temperature by measuring a material's electrical resistance--that is, its opposition to the flow of electric current. Temperature changes cause variations in the amount of a material's resistance. Generally, the greater the temperature change, the greater the change in resistance. Resistance thermometers measure the resistance of conductors and semiconductors, substances through which electric currents flow easily. Examples of these materials include copper, platinum, silicon, and various metal compounds. The thermometers then convert the resistance measurement to a temperature value. Resistance thermometers are also used extensively in industry.
I made sure that the temperature did not change during the experiment by checking the temperature by the use of a thermometer.
In our experiment we are going to use nichrome wire because nichrome wire has more resistance than copper wire. Copper wire can also become hot quickly as well, which is dangerous. Figure 5 and figure 6 explain why.
Plan
Apparatus
- Wires/leads
- Ruler and wire
- Powerpack
- Voltmeter (2 d.p)
- Ammeter (2 d.p)
- Crocodile clips
- Calculator
- Pen and Paper
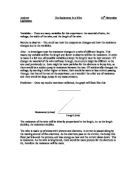
Method
- To test out how the length of a wire affects the resistance in the wire we would first set up the apparatus as shown in Figure 7.
- Then we would measure the current and the voltage at different lengths. We should use a wide range of lengths to make our experiment reliable. Table 2 shows the different lengths we are going to use.
- We would repeat all the lengths three times to get reliable results and to get an average.
Table 2
- Then we would record our results in a table and work out the amount of average resistance (average voltage/average current).
To ensure that this experiment is going to be a fair test all the variables except for the length of the wire must be kept the same throughout the experiments. Variables that should not altered include:
- The amount of voltage from the Powerpack.
The effect of these variables is explained at the beginning of my coursework.
Precautions/Safety
I would carry out the experiment keeping in mind the following rules:
- Keep the current at a safe voltage because it could become hot.
- Keep our stools well tucked under our chairs to avoid accidents.
- To use appropriate lengths of wire so that it will not start to get hot or burn.
- To keep the experiment away from the tables edge so it would not fall.
- Only turn the Powerpack on when everything is in place.
- When changing the length of wire to turn off the Powerpack.
Results
Actual results shown to two decimal places in table 3
Table 3
Anomalous results are highlighted.
Analysis
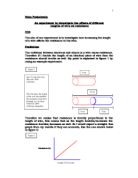
From my Graph we can see that there is a clear trend which is, as the length of the wire increases so does the resistance in the wire. Our graph looks similar to the graph, which I had predicted, shown in figure 8.
To prove that my prediction was correct I am going to compare readings from my graph.
At 15cm the resistance is 2.8 Ω, at 20cm the resistance is 3.38 Ω. So for 5cm the resistance is 3.38 - 2.8 = 0.58 Ω. Then at 25cm the resistance is 3.80 Ω. So then, at 10cm the resistance is 3.80 - 2.80 = 1.00 Ω.
My hypothesis said that if I doubled the length (from 5cm to 100cm) of wire the resistance would double as well, for 5cm the resistance is 0.58 Ω and for 10cm the resistance is 1.00 Ω (which is nearly double the resistance for 5cm). This proves that my prediction was correct and also that my experiment was successful.
The collisions between electrons and atoms in wire cause resistance. So therefore if I double the length of a wire then the resistance should double as well, this is what I had predicted. This is shown in figure 9, to prove that my experiment was successful and that what I had predicted is right.
Evaluation
I think that the experiment went quite well and I though that my results were fairly accurate and reliable. I also ensured that my experiment was a fair test, as all the variables except for the length of wire were kept unchanged throughout the experiments. Variables that were not altered include: temperature, cross-sectional area and the material. Therefore I consider my experiment a fair test. However, despite this, in reality it is difficult to keep all the variables precisely same as before. Errors may have occurred due to any of the following reasons:
- The temperature could have changed in the wire as the current following throughout it might have made it heat up a little but I don’t think this effected my results much.
- It is not possible to precisely measure the amount of voltage and current as the voltmeter and the ammeter read to 2 d.p. (decimal place).
- Another thing that can contribute to an error might be that my ruler was not all that accurate, the readings went up in 1cm and so if the length was meant to be 15cm I could have put it as 15.1cm.
There were two anomalous results, which were a bit too high for the trend they are shown on my graph (circled) and table (highlighted). I took all precautions while performing the experiment such as keeping the voltage not more than 3 volts (Powerpack) and only turn the Powerpack on when everything is in place.
Overall I thought that my experiment was very successful, however if I had more time and money then my experiment would have been more accurate and reliable.
If I had more time then I would have repeated the experiment several times (for examples, seven times) this would make my results more reliable. Plus, I could take a wider range of lengths (readings) say may be a 100 or 90 reading instead of just 45 (which is how many readings I took). Another thing that I could do was to investigate other variables, which affect resistance (for example temperature, cross-sectional area and material). Also I could take time to read/research published experiments and use other people's results.
If I had more money I would buy more specialist equipment to take reading (to 5 d.p.) this would make my experiment more accurate. I could also perform the experiment in a special lab where I can alter the temperature, to suite my experiment. I could also purchase a laptop, which could take down the readings and draw the graph for me; this also might make my experiment more accurate.
All my suggestions would make my results more reliable and accurate.
Bibliography
Here are the books/websites I referred to in providing evidence and scientific knowledge to support parts of my coursework:
- Physics 4 U by Keith Johnson p259
- Complete Physics by Stephen Pople