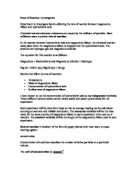
Method
An equation for the reaction:
Magnesium + sulphuric acid >magnesium chloride + hydrogen
Mg(s) + 2H2SO4(aq)>MgSO4 (aq) + H2 (g)
We will place 3cm of magnesium into a conical flask containing sulphuric acid. We will also fill up a burette with water and place it upside-down in a water trough. We will also run a pipe from the conical flask to the burette. We will count the number of bubbles produced from the reaction, which displaces the water in the burette. We will count the number of bubbles displaced over five (5) seconds, until the gas has displaced all of the water in the burette.
Results
Here are the results I obtained from carrying out my experiment, as I stated in the method. I did not change my method, to achieve these results.
100% acid 80% acid 60% acid 40% acid
20% acid
I then plotted the graphs of these results (see computer generated graphs) and, as it is clear from working out the gradients (on graphs), the gradient for the graph of the 10% acid was lower than that of the one for 80% acid. This is clearly wrong, as the reaction should have slowed down with the diluted acid. I then repeated these two results:
100% acid 80% acid
I then plotted these graphs, along with those of 60% acid, 40% acid, and 20% acid, which I retrieved the results of in the trial run. As you can see from the gradients, this second experiment matched up with what I already know.
Analysis of results (also see hand drawn graphs)
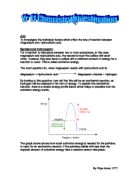
From the results in the table and the graph we can see a steady increase in the rate of reaction as the concentration of the acid decreases. This complies with my prediction. The graph shows that there is an increase in the rate of reaction as the concentration increases because the graph has its largest gradient or it is steepest at this point. We can see from the rate of reaction graph that when the concentration roughly doubles from the rate of the reaction doubles.
Conclusion
I can conclude that if you double the concentration of the acid the reaction rate would also double, this is because the ions are closer together in a concentrated solution. The closer together they are, the more often the ions collide. The more often they collide, the higher the chance of a reaction between the magnesium and the sulphuric acid. Also because there are more particles in the solution which would increase the likelihood that they would hit the magnesium so the reaction rate would increase. The graph gives us a good device to prove that if you double the concentration the rate of reaction doubles. If you increase the number of particles in the solution it is more likely that they will collide more often. In the reaction, when the magnesium hit the acid, it fizzed and produced many bubbles it was silver in colour.
Evaluation
There are many reasons why the first sets of results (for 100% acid, and 80% acid) were incorrect:
1. We may not have got exactly the same length magnesium each time.
2. We could have controlled factors in the investigation better (e.g. the stirring of the solution because if this is not done properly it can lead to incorrect results).
3. We may not have got the same amount of acid each time.
4. We may not have got the bung on correctly each time.
5. We may not have recorded the results / counted the amount of bubbles correctly.
There are many reasons why the anomalies pointed out on my graph:
1. We may not have got exactly the same length magnesium each time.
2. We could have controlled factors in the investigation better (e.g. the stirring of the solution because if this is not done properly it can lead to incorrect results).
3. We may not have got the same amount of acid each time.
4. We may not have got the bung on correctly each time.
Also, on the [hand drawn] graphs for 20% acid, there we a vast amount of anomalies. This is why I decided to draw the graph again, but with the line of best fit in a different position. This made the graph seem more fitting, and also made the gradient [of the line of best fit] seem more accurate.