An experiment to investigate whether a change in the concentration of hydrogen peroxide substrate will affect the rate of Oxygen production.
An experiment to investigate whether a change in the concentration of hydrogen peroxide substrate will affect the rate of Oxygen production.
Background
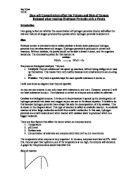
In this experiment I will be investigating whether using a different concentration of substrate (hydrogen peroxide) will affect the rate at which oxygen is produced. The reaction shown in this experiment represents the reaction that occurs in the body that turns the substrate (the reactant) in to the oxygen and water (the product). Enzymes are proteins that work as biological catalysts, meaning they speed up reactions in the cell. The Enzyme works by joining two substrates, or splitting one, this joining and splitting occurs in the active site. The active site is the section of the enzyme that is a specific shape which fits certain substrate molecules. They are said to fit like "a lock and key."
Whilst the substrate is connected to the enzyme, the enzyme weakens some of the bonds in the substrate. This either encourages the substrate to split into component elements or to join substrates, leading to the formation of a product. The product is released from the active site and the enzyme can repeat this process again.
Hydrogen peroxide enzyme Oxygen+Hydrogen
The aim of this experiment was to find out if a change in the concentration of the substrate (hydrogen peroxide) changed the rate of oxygen production when an enzyme (yeast) was added.
Prediction
I predict that as the concentration of substrate increases, so will the enzyme activity so the reaction will speed up. This is because it will increase the collision rate of the enzymes and substrate, and the quicker the substrate collides with the enzymes the quicker they can be catalysed, which increases the rate oxygen is produced.
Control variables
There are many other variables that could affect this experiment; these will be the control variables. They have to be kept the same for the experiment to be a fair test.
Increasing the temperature will increase the rate of product produced at first. This is because it increases the energy and frequency of collisions of an enzyme and substrate. But, it can also cause the bonds holding the enzyme together to break. This causes a change in the shape of the active site, therefore the substrate will not fit and the enzyme is no use and has been 'denatured'. However if the temperature is too low, the energy and collision rate decreases, meaning the rate that oxygen is produced decreases.
Another control variable is the Ph level. Ph measures acidity--water is neutral and has a pH of 7. Each enzyme has an optimum Ph level, this is mostly Ph7 or 8 (although some are different, for example pepsin, an enzyme in the stomach is better suited to acidic conditions meaning its optimum Ph level is 2). Therefore if the Ph becomes too high or too low it interferes with the chemical bonds which hold the enzyme together, denaturing the enzyme, meaning no more oxygen is produced.
Surface area could affect the rate of oxygen production. If the surface area increases then more enzymes can collide with the substrate.
The concentration of enzymes could affect the production of Oxygen as well. If there is a higher concentration of enzymes the collision rate of substrate and enzymes increases, Therefore the rate that oxygen is produced would increase because the substrate would have all been used up,
To control for these variables I attempted to keep the temperature the same, the concentration of enzymes the same, the Ph was kept constant by not adding ...
This is a preview of the whole essay
Surface area could affect the rate of oxygen production. If the surface area increases then more enzymes can collide with the substrate.
The concentration of enzymes could affect the production of Oxygen as well. If there is a higher concentration of enzymes the collision rate of substrate and enzymes increases, Therefore the rate that oxygen is produced would increase because the substrate would have all been used up,
To control for these variables I attempted to keep the temperature the same, the concentration of enzymes the same, the Ph was kept constant by not adding any additional substances to the experiment and the surface area was controlled by using the same container.
Preliminary experiment
In the first preliminary experiment we used 1.05g of yeast, and 20%
concentration of hydrogen peroxide. We measured the amount of oxygen produced after 20 seconds. We decided the independent variable would be the source of enzymes, changing it from yeast to apple, potato and to liver. In our second preliminary we decided to measure the amount of oxygen produced every five seconds up to thirty seconds so we could measure the rate the oxygen is produced, therefore having more detailed results. After the second preliminary experiment we decided to change the independent variable to the concentration of hydrogen peroxide, using 3ml each time and changing the amount of yeast to 1.5g so the reaction will be quicker.
I decided to make the concentration of the substrate the independent variable as it was easier to do this accurately than change the enzyme. It was hard to know if the different enzymes were equal in concentration so it wouldn't be a fair test.
Final experiment
In the final experiment the independent variable will be the concentration of Substrate (hydrogen peroxide), and the dependant variable will be the rate of production of oxygen. I will make sure the investigation is a fair test by only changing the concentration of H2O2, and controlling the temperature, PH, surface area and amount of enzymes; I will also repeat each measurements three times then take an average for each one. This will make it more reliable.
Equipment
* 1 stop watch to measure the amount of time the reaction has been happening so we can measure the rate the oxygen is produced.
* 1 measuring cylinder to measure the amount of oxygen produced.
* 1 delivery tube and bung to transport the oxygen produced in the reaction to the measuring cylinder.
* 1 plastic container filled half full with water to insure no gas is let into the measuring cylinder.
* 1 pipette to transport the H2O2 from the beaker to the boiling tube
* Scales to measure the amount of yeast used in the experiment.
* Test tube rack to hold the boiling tube.
Method
. Measure 2g of yeast, and 3ml of distilled water.
2. Place the yeast in a boiling tube and put that in the test tube rack.
3. Fill the plastic container half full with water.
4. Fill the measuring cylinder to the top with water.
5. Then, carefully place some scrap paper over the top of the cylinder to insure no oxygen is let in.
6. Carefully place the measuring cylinder in the container then remove the paper.
7. Place on end of the delivery tube under the measuring cylinder then clamp cylinder in place.
8. Pour the distilled water into the boiling tube and cork it with the other end of the delivery tube, then start the stop watch.
9. After five seconds measure the amount of oxygen produced on the measuring cylinder.
0. Measure the amount of oxygen after 10, 15 and 20 seconds.
1. Repeat steps 1-10 twice then take an average
2. Repeat steps 1-11 with 5%, 10%, 15%, and 20% concentration of Hydrogen peroxide.
Results
Concentration of hydrogen peroxide (%)
Time taken (s)
Oxygen produced (ml)
Average (ml)
Attempt 1
Attempt 2
Attempt 3
Attempt 4
0
5
0.0
0.0
0.0
0.0
0
0.0
0.0
0.0
0.0
5
0.0
0.0
0.0
0.0
20
0.0
0.0
0.0
0.0
25
0.0
0.0
0.0
0.0
30
0.0
0.0
0.0
0.0
5
5
3.0
2.0
.0
2.0
0
5.0
5.0
2.0
4.0
5
7.0
7.0
4.0
6.0
20
8.0
8.0
5.0
7.0
25
9.0
9.0
5.0
7.7
30
9.0
9.0
7.0
8.3
0
5
6.0
5.0
4.0
5.0
0
0.0
2
9.0
0.3
5
4.0
5
4.0
4.3
20
6.0
5.0
7.0
6.0
25
6.0
6.0
8.0
6.7
30
6.0
6.0
9.0
7.0
5
5
5.0
0.0
7.00
7.0
6.3
0
1.0
5.0
1.0
2.0
1.3
5
4.0
6.0
4.0
4.0
4.0
20
6.0
8.0
4.0
5.0
5.0
25
6.0
9.0
4.0
6.0
5.3
30
6.0
20.0
5.0
6.0
5.7
20
5
7.0
0.0
1.0
9.3
0
0.0
5.0
9.0
7.7
5
4.0
8.0
21.0
9.7
20
7.0
20.0
22.0
21.0
25
9.0
21.0
23.0
21.0
30
23.0
22.0
24.0
23.0
Key
* Valid results
* Anomalous results
Observations & interpretation
The investigation has shown that generally an increase in the concentration of H2O2 increases the enzyme activity, therefore increasing the rate of oxygen production.
My graph showed that the 0% line stays at zero the entire time, meaning that the rate of oxygen produced at this concentration is 0. This is because there was no substrate molecules for the enzymes to collide with therefore there was not any oxygen produced. This result fits in with my prediction because it is the lowest concentration and it has produced the smallest amount of oxygen.
It also shows that the 5% could have carried on reacting for longer than 30 seconds because although the enzyme activity does decrease and the line does become less steep it does not completely flatten out and is still rising slowly at the end of the thirty seconds. This is because there are more substrate molecules for the enzymes to collide with at the start, and as the experiment progresses there are less substrate molecules for the enzyme to collide with therefore the rate that oxygen is produced less towards the end of the experiment. This fits with my predictions because it is the second smallest concentration of substrate and it has the second smallest amount of oxygen produced.
On the graph the 10% line and the 15% line cross over each other so that the 10% line finishes above the 15% line. However from 0 to 14 seconds 15% was producing more oxygen than 10%, meaning that the enzyme activity was greater at the start of the experiment then plateaued out towards the end, however the 10%'s activity increased as time went on and was continuing to react at the end of the thirty second period, both concentrations could have carried on reacting for longer than the period we observed. These results do not fit with my prediction because I predicted that the higher the concentration of substrate, the greater the amount of oxygen produced, however here the smaller concentration of substrate produce a greater amount of oxygen. This is an anomaly in the results and I will discuss the sources of it in the paragraphs below.
Finally the graph shows the 20% line which was the steepest line; this means that the most oxygen was produced when the concentration of substrate was higher. This is because the collision rate is higher therefore more oxygen was produced. This fits my prediction because it is the highest concentration and produced the most oxygen.
In the experiment, we had to redo the second measurement because it was an outlier. This anomaly could have been caused by human error. We may not have placed the delivery tube cork in the boiling tube as soon as the other times and the stop watch might not have been started soon enough resulting in the anomalous results.
Anomalous results
The most obvious anomalous result is the unexpected results for the 10% concentration and the 15% concentration. The source of this anomaly could have been because the two experiments were done on different days the temperature in the room could have been slightly different, on the warmer day the enzyme activity would be increased by the heat and on the colder day the temperature would have the opposite effect on the enzymes and the activity would decrease. To ensure more reliable results we should have controlled the temperature.
Reliability
The reliability of the measurements varied. Although they were unexpected results, the 10% and 15% error bars are smaller thus making those results more reliable. It appears that the explanation above about temperature is more likely than measurement errors.
The 20% graph however has the largest error bars, the largest being from ten to nineteen, meaning that it has the least reliable results. To ensure a more reliable result we should have repeated the experiment five times then taken an average, that way we would have averaged out the errors. The 5% graph has fairly small error bars; although they aren't as small as the 10% and 15% therefore it is reliable but not as reliable as the 10% and 15%.
Evaluation
I think that the rate of oxygen production appears to be affected by the concentration of the substrate as the difference in rate between 5% and 20% is very large. However, I do not think our investigation was an overall success because the results did not prove or disprove my theory that if there is an increase in the concentration of substrate, the rate of oxygen production increases. This is Because half the results seem to prove the theory correct (0%, 5% and 20%) and the other half disproves it (10% and 15%). I don't think this investigation has worked well because I cannot give a conclusion to the title from my findings.
There were some problems with the experiment, like the anomalous result for 15%. There are many things that could have caused them, like human error, The person operating the stopwatch could have had a delayed reaction time, the person reading the results could have not read them completely correctly; also the temperature of the room could have varied on different days, varying the enzyme activity; and we were unsure how to control the ph levels which could have varied ever so slightly, varying the results.
If I had a chance to redo this experiment I would change lots of things to make the investigation fairer. Firstly instead of taking the measurements three times then taking an average, I would take the measurements five times then take an average to reduce the effect of outliers. Secondly I would make sure to monitor and control the temperature more closely to ensure that the test is fair, because if the temperature has increased the enzymes gain energy meaning that they would either have an increased activity or they will denature, changing the result of the experiment. Also I would have a longer period of time to measure the result in. Instead of every five seconds for thirty seconds, every five seconds for a minute so we could also compare when the different concentrations stop reacting, this could also change the outcome of the 10% and 15% results because the 15% might cross back over the ten percent making my prediction correct and the investigation a success.