So now to put those Ram's into context:
ZnCO3 ZnO + CO2
ZnCO3 =
65
12
+ (3 x 16)
ZnO =
65
+ 16
CO2 =
12
+ (2 x 16)
ZnCO3 ZnO + CO2
125g 81g + 44g
Now from this information, we can work out the theoretical amounts.
If 125g of Calamine produce 81g of Zinc Oxide, then 1g of Calamine will give us:
1.0g of ZnCO3 = 125
125
Therefore;
1.0g of ZnCO3 81 = 0.648 x 1= 0.65g of ZnO
125
This is a theoretical amount. So by changing the amounts of Zinc Carbonate, we can theoretically show the amount of Zinc Oxide that will be produced for each mass.
Here are the other theoretical masses showing the amount of ZnO produced:
1.0g of ZnCO3 81 = 0.648 x 1.0= 0.65g of ZnO
125
1.5g of ZnCO3 81 = 0.648 x 1.5= 0.97g of ZnO
125
2.0g of ZnCO3 81 = 0.648 x 2.0= 1.30g of ZnO
125
2.5g of ZnCO3 81 = 0.648 x 2.5= 1.62g of ZnO
125
3.0g of ZnCO3 81 = 0.648 x 3.0= 1.94g of ZnO
125
-4-
Jack Mariner Chemistry Coursework
Apparatus
To perform the experiment, the following apparatus must be used:
- Bunsen burner,
- Test tubes,
- Mineral wool,
- Calamine,
- Safety goggles,
- Heatproof mat,
- Electronic Scales.
The apparatus should be set up like this:
The Bunsen burner will be used for the heating up of the calamine. The test tubes (or other similar boiling tubes) will be needed to hold all the contents in them. The tongs will be needed for safety- if the test tubes
-5-
Jack Mariner Chemistry Coursework
have heat applied to them, they will get hotter and will therefore burn our hands. Basically they are used to hold the test tubes safely. The mineral wool is put in the top of the test tube, like a plug, to prevent solids from escaping, whilst allowing Carbon dioxide to escape. Normal wool must not be used because it would burn a lot easier and could catch on fire. Calamine must be used for the experiment to work. The goggles must be worn for protection and the heatproof mat used likewise. The electronic Scales are used for accurate measurements.
Safety Precautions
Although this experiment is very simple, safety must always be taken into account. Firstly, heat is being applied so you must lay a heatproof mat out protecting the surface below. Also goggles must be worn to protect the eyes just in case of unexpected explosions or in case something is to spit up into ones face during the experiment, tongs also must be used to handle the mineral wool, as it is an irritant. Skin contact must be avoided. Calamine can also be an irritant and should be treated and handled in the same manner
Suitable Range
The range of readings in which I ‘m going to take are between 1.0g and 3.5g of Calamine. I am going to take 6 readings. These will be 1.0g, 1.5g, 2.0g, 2.5g, 3.0g and 3.5g. In order to produce an accurate conversion chart, at least 5 readings must be taken. I have done 6 in case of any anomalies. The reason for choosing these particular measurements of Calamine is because they are spaced out evenly and easy to compare. Also these are the boundaries of our limitations. Research shows me that the largest amount of Calamine to put into the test tubes, keeping the experiment safe, is about 3.5g, therefore I have chosen this quantity as the biggest amount to be used.
Method
First we will get our equipment out and set it up. The test tube will then be weighed and recorded using the electronic scales. After that, the Calamine is placed into the test tube. This is then weighed using the same scales. To find out how much Calamine you have in the test tube, you simply deduct the weight of the test tube from the new weight (with the Calamine in the test tube).
E.g.
If the test tube weighed 15.54g, and with the Calamine in the test tube it weighed 16.00g, you could establish the weight of Calamine as being 16.00g-15.54g=0.46g
The mineral wool is then placed in at the mouth of the test tube. This is then weighed all together and recorded. This weight can then be used later to establish the individual weights of everything in the test tube.
-6-
Jack Mariner Chemistry Coursework
Next, the Bunsen burner can be set up, ready to work. This will be positioned on a heatproof mat so as not to burn the working surface underneath. The flame will be on a roaring blue flame, and the bottom of the test tube will then be placed at the top of the inner blue cone (hottest point). See (pic 1). This will stay here for 2 minutes. We will then wait for the test tube to cool down; at that time we will weigh the test tube and its contents using the same electronic scales as before, subsequently recording the results. We will then return the test tube to
the Bunsen burner. This will be repeated until the weight of the test tube with its contents is identical.
E.g.
1st reading= 17.24g, 2nd reading= 17.18g, 3rd reading=17.15g, 4th reading=17.15g
The underlined readings are identical; consequently I would stop and record these readings.
I would do it like this because when the readings are the same it means that the reaction has stopped and there is no need to go any further.
This is done for every amount.
Fair Test
There are many things that can be done to keep this experiment a fair one. Firstly the same test tube must be used as all of them have different weights. The amount of time you leave the test tube on the Bunsen burner is also crucial, as it would not be a fair test if you left one test tube in the heat longer than the others. You must measure the amount of mineral wool you put in the test tube so that you can deduct that and the weight of the test tube to get your result. Errors will be kept to a minimum with the use of digital weighing equipment.
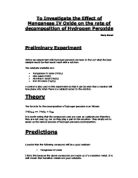
Preliminary work
My preliminary work consists of an experiment titled ‘Obtaining Copper Oxide from Malachite’. Malachite is a mineral that contains copper. In the experiment we heated the Malachite in an attempt to obtain Copper Oxide. From the experiment I acknowledged that as the mass of Malachite increased so did the mass of Copper Oxide. The experiment was extremely similar to this experiment, thus I would expect the same to happen in this case. Therefore, in this experiment, the more Calamine that is used the more Zinc Oxide that will be produced. It doesn't take a genius to work that out though.
-7-
Jack Mariner Chemistry Coursework
Results:
Chart 1
Shown above are the results from the experiment and below is a graph plotted from these results.
-8-
Jack Mariner Chemistry Coursework
Graph 1 is a bar chart showing the amount of Calamine used, plotted against the amount of Zinc Oxide produced. Although this graph may look pretty, it is not very useful. From just using these results, it is difficult to explain and understand the graph, so something else is needed: The theoretical amounts.
Chart 2.
These theoretical amounts have already been calculated. To add these to the graph like on the next page will help us to analyse the results in more detail.
-9-
Jack Mariner Chemistry Coursework
Now this graph is worth looking at. It shows the theoretical amounts of Zinc Oxide produced, plotted against the actual amount of Zinc Oxide produced. So theoretically, in perfect conditions, with a perfectly fair test in practise, the theoretical results would be achieved. My experiment however wasn't done in these conditions, which is why the results do not resemble each other perfectly.
-10-
Jack Mariner Chemistry Coursework
Graph 3 is a line graph, which I feel shows the information more clearly. From it you can see that the theoretical amounts are similar to the actual amounts of Zinc Oxide produced, however there is room for a lot of improvement. For instance, reading 2. This was done using 1.5g of Calamine. Something definitely went wrong here because it is so out of proportion to the other results.
Due to the obvious mistake I took the liberty of requesting a glimpse of another group's results, to compare with mine and to see their result for 1.5g of Calamine.
Chart 3
From Chart 3, you can see that my results are in fact relatively similar to the other group's results that I have compared with. The reasons for the differences are probably due to spillages or how concentrated the substances were, etc.
Analysing the Results
To analyse my results I shall look back at them individually. 'Chart 1' shows only my results. These were very pleasing because they were nearly as I predicted. At this stage I wasn't aware of any anomalous results as the relationship between them looked good. I am still satisfied with my results but would like to redo the test for 1.5g of Zinc Carbonate. This would give better results to analyse and to draw a conclusion from.
The second chart, 'Chart 2', showed the theoretical amounts. I included these into my experiment so that I could see how accurate my results were. Comparing with another group is good, but their results could also be wrong. Comparing with these theoretical results would show me immediately the accuracy of my results. I have drawn the graph on the next page to demonstrate this.
-11-
Jack Mariner Chemistry Coursework
So the graph is really a way of measuring your accuracy. To do this I worked out the percentage (%) yield. This was done by using the equation; % yield = actual amount
theoretical amount
From the graph you can see that the majority of my results were very accurate. I have done readings 2 and 4 in a different colour because they are obviously wrong. They both have a percentage yield of over 100%, which is impossible. The reason for this is probably due to contamination and impure Calamine. These two readings are therefore anomalous results.
'Chart 3' shows that my results are actually fairly similar to those from the other group. Apart from the obvious experiment error in reading 2, the thing that catches my attention most is the fact that my results are all higher than those from the other group. This could be resulted from a number of things, for example the use of different pieces of equipment, or the stopwatch counted seconds at slightly different rates, consequently that group leaving the test tube under the heat for a longer period of time. Or on the other hand these results maybe higher then the compared groups results as a complete coincidence.
-12-
Jack Mariner Chemistry Coursework
Conclusion
From 'graph 3', you can see that my hypothesis is of high quality stating that I predicted a graph with strong positive correlation. This was almost a perfect prediction.
My conclusion really for this experiment is that as the amount of Calamine increases so does the amount of Zinc Oxide produced from this. Theoretically this is done proportionately, but actually anomalous results interfere, leaving the results strongly related with strong correlation as apposed to a theoretical graph with perfect correlation.
Evaluation
I consider this experiment to be a success. The plan was followed very well and the results were of good quality. The measurements were done accurately, and a fair test was achieved. The procedure used was also a very fair and efficient one.
Although the experiment was a success, I am still bothered by the fact that anomalous results occured in my experiment. I think that the reasons for these results were because of time limitations. We had very little time to accomplish this task successfully, so mistakes were inevitable.
The improvements, which could be made in doing this experiment, are to have a longer time to do the experiment so that isn’t done making careless mistake and if mistakes were made, there would be enough time to redo what was needed. Secondly more high tech equipment could be used to get more reliable and accurate results. Also, an essential thing is for the Calamine used to be pure. This is important because impure calamine could react at a different rate to more pure Calamine. This would have a huge bearing on the final result. Lastly, more readings could have been taken. This would lead to averages being taken giving better results.