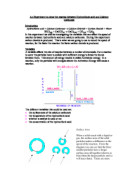
This graph shows this. For a chemical to react with another chemical the particles need to have enough energy to successfully collide, and so cause a reaction. This amount of energy changes with each experiment and is called the Activation Energy. The number of particles with energies over the Activation Energy determines the speed of the reaction, or rate of reaction. You can see from this diagram that with a low concentration few particles have more energy than the activation energy because the area of the curve that passes the Activation Energy line is only a small proportion. So from this we can predict that the rate of the reaction will be low because there will be few successful collisions and so the reaction will occur slower. With a higher concentration, such as the ‘medium concentration’, more particles have more energy than the Activation Energy, this is shown as the area of the curve passing the line is more than with the low concentration. With the higher concentration the area of the curve across the Activation energy is a bigger proportion than the smaller proportions drawn.
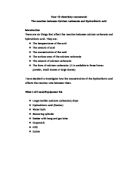
I predict that the graph to show the affect of concentration will have the same shape as this for each concentration. The steep gradient at the beginning of the graph (1) shows a high rate of reaction. This is because there are lots of Calcium Carbonate particles around to react with the Hydrochloric acid. Then the graph line gradient becomes less. This is because there are less Calcium Carbonate particles for the acid to react with. With a smaller concentration of free particles there are less successful collisions and so the rate of reaction decreases. In the last section on the graph (3) you can see quite a shallow line. This indicates that the rate of reaction is even less. This is true, as there are even fewer particles to react. When all the particles have reacted together the reaction will finish and so the graph line will level out.
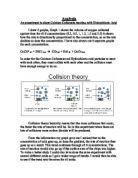
I can predict what the rates against concentration graph will look like from my other predictions. Because I predicted that ‘if the concentration of hydrochloric acid is doubled the rate of reaction will also double’ the graph should look like the one above. With double concentration there will be double the amount of collisions and so I predicted double the speed of the reaction. This will mean the rate would have doubled. If the concentration is halved I predicted that the amount of successful collisions will also be halved and so the rate of the reaction will be half. This means that if I plot all the concentrations on a graph against their rates then the graph will have a straight line running diagonally through the graph.
Method
Firstly we set out our apparatus:
The concentration of acid was decided and that was measured out, for each concentration, in the small measuring cylinder as 20cm3. The next step we did was to measure out the Calcium Carbonate chips. This was done by firstly putting the conical flask onto the measuring balance. Then clearing the clean to eliminate the flask’s fate. Then the chips were dropped in until the weight either read 2.5g or near that number (2.4g – 2.6g). This was done to make sure all of the chips measured out were used for the experiment and some were not scattered on the floor. The bowl was then filled with water. The large measuring cylinder was also filled with water and, not letting the water come out, turned upside-down and put into the filled bowl. Next the delivery tube was put under the measuring cylinder so that the delivery tube would not move from under the cylinder. If this had happened the results would have been unfair for some of the carbon dioxide produced would have escaped. Next the measuring cylinder is secured from moving by the clamp stand. Then all the equipment is laid out ready as seen in the diagram above.
The next step is to record some results. This is done by firstly pouring the acid into the conical flask with the Calcium Carbonate chips in it. Carbon dioxide is produced spontaneously and so you need to automatically secure the delivery tube onto the top of the conical flask, so that all the gas produced is bubbled to the top of the large cylinder. Also start the stopwatch immediately as you combine the two chemicals. Then, every ten seconds read off the amount of carbon dioxide produced. You can do this by looking were the water level is and reading off the measurement on the side of the cylinder (cm3). After every ten seconds the amount of carbon dioxide produced should be recorded. The experiment stops when time has gone up to 250 seconds.
For each concentration the experiment should be repeated three or more times. If one of the experiments in the same concentration looks completely different to the corresponding time (more than ten seconds lower or higher) repeat the experiment again. You can find that the different results are the more accurate ones.
When you are happy with your three chosen results for one concentration you can go onto the next whole numbered concentration (1mole, 2mole or 3mole). The different concentration of acid is pored into the conical flask with the 2.5g of Calcium Carbonate chips in it (which is measured out the same as before). Automatically secure the delivery tube onto the top of the conical flask, so that all the gas produced is forced into the large cylinder. Also start the stopwatch immediately as you combine the two chemicals. Then, as before, read off every ten seconds the amount of carbon dioxide produced. Again you can do this by looking were the water level is and reading off the measurement on the side of the cylinder (cm3). After every ten seconds the amount of carbon dioxide produced should be recorded. The experiment stops when time has gone up to 250 seconds. The experiment should be repeated three or more times. If one of the experiments in this concentration looks completely different to the corresponding time (more than ten seconds lower or higher) repeat the experiment again.
This whole routine should be repeated again with the last whole numbered concentration. Then you can start using the mixed concentrations, 1.5mole and 2.5mole. To mix up a concentration of 1.5mole you just measure out only 10cm3 of the 1mole concentration, 10 cm3 of the 2mole acid and mix these together. This creates 20 cm3 of a 1.5 mole concentration.
Preliminary Work
To find the best mass for the chemicals and equipment used in the experiment we undertook preliminary work to get an idea of the reaction and how much of the chemicals was needed and produced. This affected the:
- the size of measuring cylinders that we used for each experiment
- the size of the conical flask we used for each experiment
- the amount of acid we used for each experiment
- the amount of calcium carbonate chips we used for each experiment
We started by using 20cm3 of acid and 1.5 grams of calcium carbonate chips. We realised that if we were measuring a small amount of acid each time we would need a 100cm3-measuring cylinder (the smallest there is). We started the experiment and soon realised the 250cm3 measuring cylinder we had chosen to contain the chemicals produced was the right size for a lot of carbon dioxide was produced. We decided to get a good range of results we should aim to have the first 70cm3 of Carbon dioxide produced quickly and then to slow down. We could do this by increasing or decreasing the amount of chemicals used. With these measurements of acid and calcium carbonate chips the experiment was slow through this period of time, and so we decided to increase the measurements. We tried 25cm3 of acid and 2.5 grams of chips. This time the reaction was too fast. We decreased the proportions and ended up with our perfect measurements that we used in each experiment:
-
The size of measuring cylinders that we used for each experiment was a 250cm3 measuring cylinder for the collecting cylinder and 100cm3 measuring cylinder for measuring the acid.
-
The size of the conical flask we used for each experiment was a 100cm3 conical flask for the reaction to take place in.
-
The amount of acid we used for each experiment was 25cm3.
- The amount of calcium carbonate chips we used for each experiment was 2.5 grams.
Safety
Fair Testing
Specimen Results Table
Results
I can see many inaccuracies after plotting graphs. I have drawn the graphs with the averages on them and also all of the other results (for experiment one, two and three). I have recognised that the average results were going to be more accurate so I have joined these up. However, from joining these points I can see a lot of important inaccuracies that I have made while completing these experiments. Firstly on the ‘1 Mole’ graph you can see that the steady curve is disrupted by a number of points: 80 secs by 77 cm2, 130 secs by 104 cm2 and 130 secs by 105 cm2. Then on the ‘1.5 Mole’ graph you can also see that the curve is disrupted by a number of points: 70 secs by 90 cm2, 200 secs by 176 cm2, 220 secs by 182 cm2 and 240 secs by 191 cm2. On the ‘2 Mole’ graph you can again see that the curve is disrupted by a number of points: 20 secs by 19 cm2, 140 secs by 127 cm2 and 320 secs by 187 cm2. On the ‘2.5 Mole’ graph you can see that the curve is disrupted by a number of points: 60 secs by 120 cm2, 130 secs by 214 cm2 and 190 secs by 265 cm2. On the ‘3 Mole’ graph you can see that the curve is disrupted by a number of points as well: 60 secs by 130 cm2, 90 secs by 186 cm2 and 110 by 224 cm2. By also drawing all of the other results onto the graphs (experiment one, two and three) we can also see the accuracy of each recording. If the ‘accuracy line’ is long we know that the recordings done in that period of time were not all done accurately. The highlighted recordings show that they are inaccurate.
Analysis
I can see from my results that the pattern I predicted for the graphs to show the affect of concentration was correct. They each had a similar shape for each concentration. The steep gradient at the beginning of the graph (1) shows a high rate of reaction. This is because there are lots of Calcium Carbonate particles around to react with the Hydrochloric acid. Then the graph line gradient becomes less. This is because there was less Calcium Carbonate particles for the acid to react with. With a smaller concentration of free particles there are less successful collisions and so the rate of reaction decreases. In the last section on the graph (3) you can see quite a shallow line. This indicates that the rate of reaction is even less. This was true, as there are even fewer particles to react. When all the particles have reacted together the reaction finishes and so the graph line levels out. For a higher concentration the gradient at the beginning of the graph (1) was steepest, as the rate of reaction was high. For a lower concentration, however, the gradient at the beginning of the graph (1) was less steep for the rate of reaction was less. The last section of the graph (3) you can see quite shallow line. This is the same for each concentration for at this point the rate of reaction is less. This is because there are fewer particles to react. When all the particles have reacted together the reaction finishes and so the graph line levels out and that is why it is the same for each experiment.
I predicted what the rates against concentration graph would look like from my other predictions. Because I predicted that ‘if the concentration of hydrochloric acid is doubled the rate of reaction will also double’ the graph should look like the one above. With double concentration I predicted there would be double the amount of collisions and so double the speed of the reaction. This would mean the rate would have doubled. I predicted if the concentration was halved the amount of successful collisions would also be halved and so the rate of the reaction would be half. This meant that if I plot all the concentrations on a graph against their rates then the graph would have a straight line running diagonally through the graph. Now that I have completed his investigation I have plotted the real ‘rates against concentration graph’ I can see that my prediction was correct. The line of best fit for this graph runs right through the graph. If I had increased the scale of the ‘concentration’ axis to be the same length as the rate axis the line of best fit would have run at a 45o angle through the graph. This shows that my prediction was correct and that if the concentration was doubled the rate also doubled.
Evaluation
I think our experiment went quite well for I could see an obvious pattern in our results. This meant that I could understand what was happening in the experiment and why certain things happened when they did. For example I now understand how concentration of acid affects the rate of the reaction between Hydrochloric acid and Calcium Carbonate. I predicted that if the concentration of hydrochloric acid were doubled the rate of reaction would also double. I predicted this because with a larger concentration of hydrochloric there will be more hydrochloric particles in the same mass of acid. This will mean there will be more collisions against the calcium carbonate particles. With more collisions there is a higher chance of successful collisions. With more successful collisions it is more likely that the collisions will create a reaction. This will mean that the rate of reaction will increase. With fewer particles of hydrochloric in the acid there will be less successful collisions in a given period of time so the speed of the reaction will decrease and so the rate of reaction will also decrease.