How the experiment was carried out:
I took a 10cm long sample of Elodea Caledensis (pondweed) and placed this inside a 50cm3 syringe. I attached a capillary tube to the end of the syringe with a piece of rubber tubing. I filled the syringe up with water and with a heaped spoonful of sodium hydrogen carbonate. Then I put the plunger into the syringe and pushed any oxygen inside the syringe out, making sure to leave a few bubbles at the end of the capillary tube closest to the syringe. I then put the syringe in a retort stand so that it could be held up. I placed the end of the capillary tube inside a beaker full of water standing on a bench. I placed a transformer on the bench and plugged it in, connected it to the lamp and placed the lamp adjacent to the syringe containing the pondweed. I then set the transformer to the highest wattage (12watts) and then left it for 3 minutes prior to the test. I then began recording the length of water displaced (the length that the bubble had travelled) over the period of a minute and recorded the amount to work out the volume using this formula: π r 2 h or pi X radius (0.5) 2 X h.
Prediction
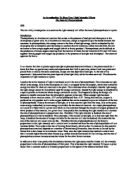
I predict that the light intensity (controllable by volts) will be directly in proportion to the rate of photosynthesis. Until the light intensity is no longer a limiting factor and there is another limiting factor(s) i.e. Carbon dioxide. I predict that the rate of photosynthesis will increase in proportion to the light intensity as long as there are no other limiting factors. This is because the plant seeks to perform photosynthesis in order to stay alive; the plant will photosynthesise at the optimum rate in the conditions provided. I believe that above a certain light intensity the plant will no longer be able to increase its rate of photosynthesis as there is another limiting factor. i.e. light intensity will no longer be a limiting factor and there will be another factor limiting the rate of photosynthesis e.g. temperature or There will also be a point at where the temperature of the water becomes so hot that the chloroplast cells would de-nature. I predict that if I where to make a graph of my results with voltage along the x axis and amount of oxygen produced per minute along the y axis, I predict that the graph would look like this:
The Equipment I will use
- 1 retort stand
- 1 12 watt bulb (with variable intensity)
- 1 lux meter (light intensity meter)
-
1 piece of pondweed (elodea canadensis )
- 1 beaker with water
- 1 capillary tube
- 1 cardboard box
- Sodium hydrogen carbonate, a surplus amount (heaped spoonful)
-
50cm3 syringe.
Results
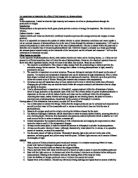
The results showed that the amount of oxygen released, or rate of photosynthesis is directly in proportion to the amount of light or wattage. Below certain wattage, in this case, 6, the rate of photosynthesis extremely drops. At this time I would imagine that the plant is struggling to photosynthesise and so has slowed down the rate of photosynthesis.
Conclusion
The conclusion I made is that plants will photosynthesise in relation to the wattage of light up to a certain point until another factor e.g. temperature or carbon dioxide is limiting the rate of photosynthesis. This theory is called ‘limiting factors’. In this test the point where light intensity is no longer controlling the rate of photosynthesis is obvious. It is at the point where the gradient of the graph plateau’s out. At this point
I would think that the temperature was a limiting factor. In ideal conditions of temperature, Co2 and water would be in plentiful amounts therefore the plant would continue to quicken the rate of photosynthesis. From these results, I am able to say that an increase in light intensity does certainly increase the rate of photosynthesis.
The gradual decrease in the rate of increase of the rate of photosynthesis (the swallowing of the curve) can be attributed to the other factors limiting the rate of photosynthesis. As light intensity increases, the photosynthetic rate is being limited by certain factors, such as carbon dioxide and temperature. These factors do not immediately limit the rate of photosynthesis, but rather gradually. As light intensity increases further, so the rate of photosynthesis is being limited by other factors more
and more, until the rate of photosynthesis is constant, and so is almost certainly limited in full by another factor.
Evaluation
If there was any way I could have made the test any fairer it would have been to prevent temperature from becoming a variable, I would have done this probably by placing the entire experiment in a huge test tube this test tube would have a flow of water running through it to remove heat and prevent temperature from changing. This test tube would also be acting as the beaker.
I could make this experiment more accurate by questioning weather all of the oxygen is contributing to the down force pushing bubbles down. Some of the oxygen may be dissolved in the water and I could find a more accurate way of measuring the distance travelled by the bubbles. Also I could have positioned a volt meter in between the transformer and the lamp to get an exact measurement of the voltage used.
Also temperature was a variable so using the above method of a large water bath test tube could prevent this. I did not encounter any anomalous results but my graphs do not show the plateau, or flatting out that I described. This is because the light was still a limiting factor and the higher voltages where not capable and therefore could not be tested.