Whether the wire is insulated- If the wire is not coated some of the current may be able to pass from the wire into the air. However, even if this did happen, it would make no significant difference to my results so I will not worry about this when I carry out the experiment.
I will look into how the length of a piece of wire resistance effects the resistance it offers because length is easy to measure and change. I will also look at how the diameter of the wire affects the resistance for the same reasons.
Equipment and Plan
When I carry out the experiment I will use:
-
Power pack- to limit the voltage across the circuit
-
Ammeter- to measure the current
-
Voltmeter- to measure the volts across the resistance wire
-
Variable Resistor- to change the current
-
Ruler- to measure the resistance wire
-
Various diameters of resistance wire
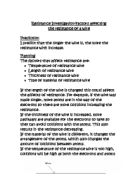
This is a circuit diagram of the set-up I will use:
When I do the experiment about how the cross-section area effects the wires resistance, I will set up a parallel circuit so I can add wires. This will be equivalent to increasing the cross-section area, doing it like this will allow me to take more reading more easily. For the length experiment I will just change how long a piece of wire is.
Preliminary Experiment
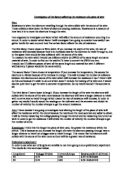
My preliminary test showed me that when I use a multimeter, I got very different results to when I used a power pack, ammeter and a voltmeter. This is because the battery in the multimeter has an internal resistance so all the results are higher (as shown in the graph below).
Using Mutimeter
Using Power Pack
Resistance
Internal
Resistance
Length
Internal resistance is found by looking at where the line for the multi meter crosses the Y-axis. I could work out the internal resistance of the multi meter and subtract it from my results, but this would take a long time and it would be easy to make mistakes so when I do the experiments I will use a power pack, an ammeter and a voltmeter. It also showed me that the results are more consistent with a voltage under 3 volts. I also found the resistance of a piece of wire less than 10cm is too small to be worth measuring, also if the piece of wire is under 10cm it starts to get hot (see variables that may effect my results).
Range
For the length experiment I will change the length of a 0.31 mm diameter piece of wire in 10cm steps from 10cm up to 70cm. This will give me 7 readings – plenty to be able to see a trend in a line graph and quite a big difference between the highest and lowest results. I will start with one wire and add one wire at a time up to 10 wires. This will give me 10 results– plenty to be able to see a trend in a line graph.
Fair Testing
I will keep the experiments fair by:
- Using the same piece of wire each time for the length experiment,
- Using the same power pack, ammeter variable resistor voltmeter
- Only change one variable per experiment.
- I will keep the voltage under 3 volts, this will prevent the wire getting warm (see variables that may effect my results)
Reliability
- To keep my results reliable, I will wait for the ammeter and voltmeter to stop fluctuating before I take my results.
- If possible I will check my results with someone doing the same or similar experiment.
- I will keep a sketch graph as I go. If a result appears to be anomalous I will spot it early therefor I will be able to re-do it straight away.
Prediction- for the length experiment
I predict that the length of a piece of wire will be directionally proportional to its resistance. I think this because if the length double, so will the number of molecules in the path of the de-localised electrons. This means they will have to use twice the energy to get through it.
Prediction- for the cross-section area experiment
If the wire’s width is increased the resistance will decrease. This is because of the
increase in the space for the electrons to travel through. Due to this increased space between the atoms there should be less collisions.
Obtaining Evidence
For all the sets of data, I used the formula: Resistance = Voltage
Current
Results for cross-section area experiment
Results for length experiment
Analysing and Concluding
Cross–section area experiment
The cross-section area graph has negative correlation. It shows indirect proportion between cross-section area and resistance.
Length experiment
My graph has a straight line going through the origin. This means, length and resistance are directly proportional. This is because if the length double, so will the number of molecules in the path of the de-localised electrons. This means they will have to use twice the energy to get through it.
Evaluation
All of my graphs look reliable. I have plotted enough points close enough to the line to be confident that my conclusions are correct. There was a bit of spread in my results, but not enough to cast any doubt on my conclusions.
we took quite a long time to set the equipment up for our practical work, but once we had a circuit that worked, it was relatively quick and easy to gather our results.
The biggest source of error in both experiments would probably be human error in measuring the wire. The degree of accuracy seemed to increase with the more or longer wire we used. I did not find any anomalous results.
I might have been able to obtain more accurate results by using an ammeter and a voltmeter that had more decimal places on the display
On the whole I think this has been a successfully experiment. If I had more time I would have taken more repeats for the length experiment. If I wanted to take these experiments further, I could do an experiment to see if the same rules apply to wires made of different materials such as nickel, copper, manganese etc.