Preliminary Experiment
A Preliminary Experiment can be described as a minor match preceding the main event. I had an opportunity to set up my experiment and learn what I will need to do for the full experiment. Allowing me to get a rough idea, of some of the challenges I may have to face, when attempting to carry a successful experiment. I decided to not exceed a maximum voltage of 4V (volts), as the wire had smoke precipitants and the wire heated uncontrollably at short lengths of the Nichrome Wire, warning me about the importance of protective gloves. Also, because of this I decided to start my length at 40cm to 100cm; hindering the risk of possible accidents.
Fair Test
An experiment will be required in order to investigate, if the length of a wire affects its resistance. But in order for me to get accurate results, or at least trustworthy results, I need to manage what variables I have to keep the same, or need to alter.
- The Voltage of 4V, from the power supply, that will be flowing through the circuit I will keep the same. In addition, it does not matter about the power output, whilst calculating resistance, as voltage and current do not affect resistance.
- I will keep the same type of wire, in order to not increase or decrease current flow.
-
I will need to change the length of wire, this will allow me to investigate if the longer the wire, the higher the resistance or the opposite.
In order for me to achieve accurate results, I will plan on repeating the experiment more than once.
Equipment List
- 1 Metre Ruler
- Voltmeter
- Ammeter
- 1 Circuit Board
- 6 Insulated Wires
- 2 ‘Crocodile Clips’
- 2 Cells
- 100cm of Nichrome wire
Method
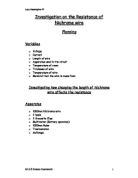
- Set-up the required circuit as shown above.
- Use a metre ruler, to measure 40cm of wire, and attach ‘crocodile clips’, to the required measurement on the Nichrome wire.
- Turn on Power supply.
- Wait one minute to achieve confident readings.
- Take readings of Ammeter and Voltmeter, and place in a results table.
-
Workout the Resistance. (Resistance (Ω) = Voltage
Current)
- Turn off Power Supply, and repeat with:
50cm, 60cm, 70cm, 80cm, 90cm and 100cm.
- (Repeat Method 1 more time, to ensure the experiment was a fair test and that the results obtained are reliable).
Results Table
Create a results table much like the one below and record the results, into it.
Obtaining Evidence
Safety
Doing this experiment I had to only take a few safety precautions, to ensure the safety of me and fellow members of my class; whilst the experiment was performed.
- I made sure that I turned the power supply off each time I was not using the equipment, this will avoid any electrical shocking or burns, if temperature is too high. This also leads to an unfair experiment, because increase in temperature is one of the four criteria’s, which affect resistance.
- I Kept the Voltage passing at 4V; this is because it will overload the current, causing a precipitant of smoke to come out. This leads to increase in temperature again, meaning an unfair effect on the resistance and invalid results.
- Gloves were worn when I carried out the experiment. This is vital especially when dismantling the experiment. The Nichrome wire, which may have experienced high temperatures, may still be very hot.
- Taking Care of what you do is important when carrying out this experiment. It will hinder the risk of accidents within the experiment.
Results Data Number 1
Ohm’s Law
Voltage: Electric potential or potential difference, written as volts. It is the push and pull of the potential difference between two points, which causes electrical current to flow through a wire or device, which is connected across them.
Current: The rate of flow of an electric charge. Current is measured in amps.
Resistance: The resistance to flow of electricity through a material.
Results Data number 2
Analysis
Graph Data of Results no. 1
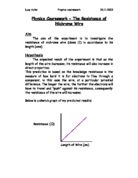
The graph data results for set number 1 appears to have a steady positive correlation, implying that in fact, the length of wire is proportional to resistance. So far, the results seem to prove my prediction correct and valid, with no signs of invalid data.
Graph Data of Results no.2
The graph data results for set number 2, also have a positive correlation however, with 2 signs of invalid data.
On the other hand, they also show that length of wire is also proportional to resistance.
Conclusion
From the results, I found out that the longer the wire; the higher the rate of resistance. My first result with a 40cm wire, had a resistance of 3.19Ω (Ohms), and as I increased the wire to 60cm, the resistance also increased to 5.97Ω (Ohms). This proves my prediction and scientific knowledge correct.
Scientific Knowledge has proved itself correct. An electric current flows when charged particles called move through a conductor. The moving electrons can collide with the of the conductor. This makes it more difficult for the current to flow, and causes resistance. Electrons collide with atoms more often in a long wire than they do in a short wire. A thin wire has fewer electrons to carry the current than a thick wire. This means that the resistance in a wire increases as:
- The length of the wire increases.
- The thickness of the wire decreases.
- EVALUATION
Finally reaching my evaluation, I believe that my method provides the reader with accurate and reliable results. Scientific Knowledge supported my results, as the results came up as a positive correlation.
Also, my first results do not seem to have any invalid data, due to the steady increase on my graph.
The second results may have invalid data, as it has an unsteady increase, at the points of 20 to 40cms.
Perhaps I retained odd results by invalid results from the apparatus, i.e. ammeter and voltage. I also, may have recorded the results incorrectly, due to poor measuring on the nichrome wire.
To improve my results, perhaps I should have completed the results at least 3 times, in order to get a broader conclusion of my results. In addition, as a student I only had basic equipment to carry out this experiment; Using advanced equipment, I would be able to calculate results correctly, rather than estimating with dubious equipment.
The data I have provided is sufficient, I believe. This is due to the guidelines I have provided in making sure, you achieve, accurate and valid results. In order to do this experiment correctly, you must do it at least more than one time, with caution on the last attempt.
In addition, my results confirm my prediction correct. My prediction of this investigation was that resistance is proportional to length. For example the resistance of a wire of 70cm should be higher than a resistance of a wire at 10cm, In fact 7 times more resistant. Resistance will increase with length. Resistance is in fact proportional to length. This statistically, meant that the results plotted on a graph; will have a strong positive correlation.