The energy (gas) given off becomes more as surface area increases, therefore I predict the reaction using the powdered chips will produce the highest amount of gas in the time allowed.
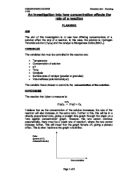
Based on my own knowledge, if I were to predict the shape of the graph for a certain size of chips at this early stage in the investigation, given the amount of gas produced and the time taken, I would expect the graph to be like this:
Furthermore, I hypothesis that if the surface area is increased, the rate of reaction will increase at a proportional rate.
I have chosen this variable because:-
The temperature will be very hard to control, as it never remains constant and difficult to get the exactly right temperature.
I do not have the use of a catalyst, as there isn't one for this particular reaction.
Equipment:
A stopwatch, a conical flask, a delivery tube, an electronic scale, rubber tube, water, basin, 3 different sizes of Marble chips (preferably - medium, small and powdered.), 1 M Hydrochloric Acid, safety goggles, measuring cylinder,
Method
1. Set the apparatus as shown above.
2. I will measure out 25cm3 of 1 Mole of Hydrochloric Acid. I did this by using a measuring cylinder.
3. I will pour the acid into the conical flask. For safety I will wear goggles.
4. I will measure out 4g of marble chips on a scale and put them in the flask, as soon as all the marble chips are in the flask, I will put the rubber tube in the flask and start the stopwatch.
5. For every 15 seconds, I will take the measurement of the of gas produced, in the measuring cylinder by looking at the stopwatch continuously to see the time the reaction has had.
6. I will repeat steps 1-4 while changing the size of the marble chips, as I am using 3 sizes - Small, Medium, and Large, I will start sequentially with the smallest one. Making sure taking the same amount of chips and hydrochloric acid at each time.
7. If time allows, repeat the experiments in order to improve the reliability of the results.
Variables:
Independent variable: This will be the size of the chips as this is the factor that I intend to change.
In our experiment involving surface area the independent variable is the surface area. The independent variable is the part of the experiment that can be changed, i.e. in this case we are changing the surface area so it is the independent variable'.
Dependant variable: The volume of gas produced and the rate of the reaction as this will change because of this.
The dependent variable in our experiment is the CO?2?. The dependent variable is the part of the experiment that changes as a result of changing the independent variable.
Control Variable: Keeping this the same throughout the experiment will result in a fair test. They are the total mass of marble chips, concentration of the hydrochloric acid, and the temperature of the room and volume of HCL
The fixed variable in our experiment is the temperature and the concentration of hydrochloric acid. The concentration of HCL is always the same and in order for it to be a fair test it cannot be changed. The temperature is always room temperature.
Fair Test
My experiment will be a fair test as I have use the same equipment and I will use a measuring cylinder to ensure that I measure out the same quantity of acid each time. I will use the same mass of chips so that there are not varying amounts of marble chip particles, as more chips would mean more reacting and vice versa, yet I changed their surface area.
I will try my best to ensure that the temperature is the same throughout the experiment as the temperature can affect the rate of reaction, as stated in my scientific knowledge.
I started the stopwatch when all the chips were been poured into the conical flask and the rubber tube has been attached to the flask. This is so that if any gas escapes, it is approximately the same quantity each time.
I repeated the results 3 time so that I can spot any anomalies due to inaccuracies.
In order to keep a fair test, only the surface area (i.e. size) of the marbled chips is variable. Other variables are to be kept constant to avoid obtaining wrong results. These other variables include:
*Temperature: -temperature of the reactants are kept at room temperature.
*Volume of acid: - the volume of acid is kept constant at 25cm3
*Concentration of acid: - the concentration of acid is kept constant at 1Mol/dm3.
*Mass of chips: - the mass of chips use is fixed at 4g.
*Surface area of the conical flask: - the size of the conical flask is kept constant.
The HCl cannot be used again after the reaction because the acid becomes less strong to react with the acid.
In taking the readings of gas from the cylinder, I need to be accurate in taking my readings as an inaccurate reading may cause errors and alter my results. The surface area of the chips needs to be appropriate and vary in different experiments to get the correct rate of the reacting size.
Safety
In order to make the experiment safe goggles and lab coats must be worn at all times as a protection in case of a spillage. Tie up hair so that I can see what I am doing and so that there is minimum risk of it being burnt if someone else in the lab is using a Bunsen burner, or knocking over equipment that happens to be lying around. we have to be careful because the acid is highly corrosive to our bodies and should be kept away from skin and from our clothes.
Experiment
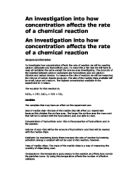
Aim: To investigate the speed of the chemical reactions affected by the size of marble chips, when reacting with Hydrochloric Acid.
Predication: I predict that the Size of marble chip will affect the reaction rate, by: The larger the Marble Chips the slower the reaction rate, and the Smaller the Marble Chips, the faster the reaction rate. I predict this due to the fact that the more surface area, the more likely a reaction is to take place, which is based upon Collision Theory.
apparatus:
A stopwatch, a conical flask, a delivery tube, an electronic scale, rubber tube, water, basin, 3 different sizes of Marble chips (preferably - medium, small and powdered.), 1 M Hydrochloric Acid, safety goggles, measuring cylinder,
Method
1.Set the apparatus as shown above.
2. I will measure out 25cm3 of 1 Mole of Hydrochloric Acid. I did this by using a measuring cylinder.
3. I will pour the acid into the conical flask. For safety I will wear goggles.
4. I will measure out 4.5 of marble chips on a scale and put them in the flask, as soon as all the marble chips are in the flask, I will put the rubber tube in the flask and start the stopwatch.
5. For every 15 seconds, I will take the measurement of the of gas produced, for medium and small chips in the measuring cylinder by looking at the stopwatch continuously to see the time the reaction has had.
6. For the powdered chips I will take the measurement every 5secs
7. I will repeat steps 1-4 while changing the size of the marble chips, as I am using 3 sizes - Small, Medium, and Large, I will start sequentially with the smallest one. Making sure taking the same amount of chips and hydrochloric acid at each time.
8. If time allows, repeat the experiments in order to improve the reliability of the results.
Experiment
1st experiment
Average results
Formula for working out:
Average Rate of reaction == total volume of CO2 in cm3
______________________________
Total time for reaction
2nd experiment
Average results
Formula for working out:
Average Rate of reaction == total volume of CO2 in cm3
______________________________
Total time for reaction
3rd Experiment
Average results
Formula for working out:
Average Rate of reaction == total volume of CO2 in cm3
______________________________
Total time for reaction
4th Experiment
Average results
Formula for working out:
Average Rate of reaction == total volume of CO2 in cm3
______________________________
Total time for reaction
From these calculations I will plot my graph
Analysing Evidence and Drawing a Conclusion
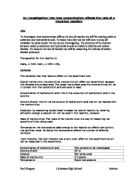
The results should have concluded my theory that as the size of the CaCO3 decreased the rate of the reaction should have increased. I can prove this because the smaller the pieces of CaCO3 the more area there is for the HCl to collide with and the reaction should get faster. This is shown in the diagrams below:
These diagrams are showing that because the CaCO3 particles are more dispersed in the right diagram than the left and so there is more chance of an HCl particle hitting a CaCO3 particle.
Anomalous results - The circled results in my graph, appear to be anomalies, I can see that they are anomalous because they do not fit the predicted graph or the line of best fit.
Furthermore, if we calculate the average amount of gas produced every second for each reaction, it is quite evident that there was same amount of gas produced with a larger surface area, but also that it is produced much faster. In the large pieces, there was an average of 6.54 cm3 of gas produced per second. In the medium-sized pieces, there was an average of 6.59 cm3 of gas produced per second. Lastly, in the powder, there was an average of 15.4 cm3 of gas produced per second.
This shows the rate of reaction is fastest when increasing surface area.
A tangent was drawn at the beginning of each curve and its gradient calculated, the gradients are shown in the table below.
From these gradients it is clear that powdered marble chips reacted the
fastest than to the medium or the small marble chip. This is shown because the
gradients of powdered marble chip from both graph is the highest with 10 cm3 and 11.3 cm3. As the surface area increases so does the rate of reaction. Increasing the surface area increases the speed of the particles. The faster the particles move, the greater the number of collisions, and therefore the rate of the reaction increase.
Also from the graph you can clearly see that powdered chip's reaction ended much earlier in just about 25 seconds than to medium chips, which ended in 2 minutes, and the small chips ended in 80 seconds.
From the graphs I cansee that by increasing the surface area the rate at which the gas was produced also increased. The line which represented the amount of gas given off on the graph was steeper in the test using powder therefore the gas was produced at a faster rate. Roughly the same amount of gas was produced in all tests. Therefore my hypothesis was correct.
Analysing from my average results in my first experiment, the results were different from what I would have expected.
This is because of the average result of the medium chips was 0.93 cm3 and rate of reaction for small chips is 1.30 cm3. This result has proved that the more surface area the faster the reaction. Furthermore the powdered chips would be expected to slightly higher then the small chips which in this case has not happened - 0.94 cm3 /s.
Second experiment- in these sets of average results the averages turned out well.
With medium chips the rate of reaction was- 0.41cm3 /s. With small chips the average was 1.33 cm3 /s. With powdered chips the rate of reaction was higher-1.78 cm3 /s than the small marble chips. This has proved my hypothesis.
Third experiment- again this experiment turned out well of how it was expected. With Medium chips the average result was 0.71 cm3 /s. The small chips were 1.34 cm3 /s. Although there's a difference of 63 cm3 this still proves that medium chips reacted much slower due to surface area so therefore had a lower rate of reaction.
With the powdered chips the rate was higher then the small chips- 4.36cm3 /s. There was a difference of 3.02 cm3 this is still has proved my prediction.
Fourth experiment-unfortunately in these series of results it did not turn how it should have because medium chips rate of reaction was 0.76 cm3 /s. The small chip's rate of reaction was- 1.34 cm3 /s, whereas the powdered chips rate of reaction was 0.81 cm3 /s. This rate of reaction was actually slower than the rate of reaction for the small chips.
On the whole these results, which don't fit in, the trend is maybe because of human error. I can explain these by listing the ways in which our experiment could be flawed:
There was sufficient time at the beginning of the experiment for the gas to escape from the conical flask, while the bung was being put in place, although small, this could affect our results.
Also miscounting the amount of CO2 in the measuring cyclinder produced every 15 secs.
In the graphs, I saw distinct patterns: they all have positive link that illustrates that they all have the same trend. The graphs are more efficient in describing the same effects as that of the chips because it shows clearly that the increase in surface area, the larger amount of carbon dioxide produce and the faster the rate of reaction.
To work out the average I added the volumes of the four experiments and divided them by 4. I have worked out an average because then the results will be evaluated properly and will be plotted on a graph that will give a visual comparison between the surface area. From the results of my experiments I observed that each of the reactions start of fast but start to slow down after some time.
On the following pages are graphs showing the rates of different surface areas. On each graph at different size of chips, I have both my results to show how they are related to each other by following the same rising pattern. Then on my final graph I have plotted the averages of all sizes of chips. This makes it easier and clearer to compare the quantities of gas for each experiment.
My prediction was correct because the surface area of the smaller pieces was bigger than that of the larger pieces. This is because when a solid is broken down into many smaller pieces it has a larger surface area and therefore it can react with more of the hydrochloric acid. In this experiment as the surface area was increased the reaction took place a lot quicker proving my earlier theory correct. Therefore as the surface area increased so did the rate at which the CO?2 was produced.
I also observed that during the experiment the amount of gas produced is big at the beginning of the reaction, but it slows down towards the end of the reaction, this is because the activation energy (EA) which it had at the start gave a boost to the production of gas and at this point it would have been the fastest, until it had worn off which would be in the middle or the end.
Evaluation
Overall I am pleased with my results and the way the experiment was carried out. I think my results were fairly accurate and proved my hypothesis. To make the overall experiment results more accurate we repeated it four times and then took the average.
If I was to do this experiment again I would probably make it more accurate by using a Burette to measure the amount of gas given off, this would measure a lot more accurately the amount of gas given off. Also using a syringe inserted through the rubber tubing to add acid to the chips solves the problem of losing gas at the beginning of the experiment.
As I repeated the experiment 4 times and worked out the average rate of reaction in each test, I think my results are quite reliable. However, I could make further improvement by increasing the number of tests and taking the results with a smaller gap such as 10 seconds instead of 15. I could also increase the amount of Calcium Carbonate to more than 4.5g and keep the amount of acid as 25ml; which would slow down the reaction and will allow me to take more accurate results, as it would decrease the number of anomalous results.
Also at the beginning of each experiments, I had to pour the acid in the conical flask and put the rubber tubing on the conical flask. As soon as the acid is poured into the conical flask, the reaction begins and some gas might have been lost. Which may have lead to a anomalous result.
I had only one anomalous result due in the experiment; this is why I chose this factor to show the effect on the rate of reaction. The only odd result that I had was with the medium size chips-time taken 45 secs-66cm3.
I would like to also investigate other factors, which affect the rate of a reaction like temperature and concentration to see how they affect the rate of a reaction.
I think my experiment was successful as I was able to obtain the evidence I needed to achieve my aim. I was planning to observe each reaction every 15 secs but I was unable to do so because the reaction using the powdered marble was very quick and therefore observed it every 5 secs.
My graphs helped in proving my aim. A distinctive trend is shown in the graph as clearly show that small particles react faster than large particles.
I was interested in this experiment when I first started. I was interested in seeing changes in the reactants at the end of the reaction. I was very satisfied when I found out that my predictions were correct.
To furthur my experiment:
I could use sulphuric acid. This is a dibasic acid and its molecular build-up is H2SO4 and hydrochloric acid is 2HCL, because of this I would obtain different results. I could also use phosphoric acid, which is a tribasic acid, and its molecular build-up is H3PO4, I would also obtain different results if I used this type of acid. Nitric acid is a monobasic acid but its molecular build-up is HNO3, which is very similar to the molecular build-up of hydrochloric acid so the results that I would obtain from using this acid would be similar to the ones I already have, so I would not use this for any further experiments. The reason I could use a different type of acid for any further work is to find if there is a difference between them if their molecular build up is different.
I could also use the less reactive metals of the reactivity series (zinc, aluminium, iron and lead).