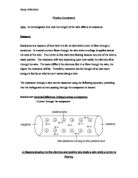
PROCEDURE
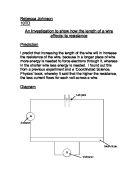
- Set up apparatus as shown is the diagram above
- Lay a piece of constantan wire along a 100 centimetre ruler and pull it straight
- Measure the piece of wire and cut it, using wire cutters, on the 100 centimetre mark
- Clip either end of the wire with crocodile clips
- Connect the wire in the circuit, as shown in the diagram above
- Turn on the power pack at the mains and then flick the switch on the power pack
- Turn the power on the power pack to 6 volts
- Wait a few seconds... until the readings have settled
- Record the readings on both the voltmeter and the ammeter
- Place your results in a table
Repeat this procedure adjusting the length of the wire, decreasing the length by 10 centimetres each time until the length is 10 centimetres long.
- Having collected a full set of data work out the resistance for each result by using the formula:
R = V R = resistance V = voltage I = amps
I
SAFETY
For reasons of safety I must make sure that the wire does not over heat due to the voltage passed through the circuit being too high and as the wire is not being insulated this may occur and also I must not touch the wire during the experiment in case it has over heated and I am unaware of the situation. To control the temperature I will adjust the variable resistor if and when necessary. I must also be carefully when using the wire cutters and finally to look out for possible dangerous which may occur during my experiment.
FAIR TEST
To make my experiment a fair test there are certain variable which must remain constant, these are:
- Use the same ammeter and voltmeter
- Use the same piece of wire
- Keep the power pack constant at 6 volts
- Connect the wire, once altered, into the same circuit each time
- Use the same 100 centimetre ruler
The variables that must be changed are:
I am also going to wait approximately five seconds, having switched on the power pack, for the ammeter and voltmeter to settle to get a more accurate result. I will repeat the experiment so that perhaps if an error occurred the first time I will know.
NUMBER AND RANGE OF OBSERVATIONS
I will adjust the length of the wire, decreasing the length by 10 centimetres each time until the length is 10 centimetres long in total, to get a clear spread of results. I will then repeat my experiment to make sure that all my previous results are correct and also to get a range of results.
THEORY AND PREDICTION
Ohms law states that; ‘the electric current (I) flowing through a given resistance (R) is equal to the applied voltage (V) divided by the resistance, or I = V.’
R
Electricity is the flow of electrons; the current is the amount of charge per second and voltage is the height of electrons. Resistance: is when an electric conductor opposes a flow of electricity and disperses electrical energy away from the circuit, usually as heat. Optimum resistance is provided by a conductor that is long, small in cross section, and of a material that conducts poorly.
There are three basic systems of units used to measure electrical quantities, the most common being; ampere which is the unit of current and can be measured using a ammeter, volt which is the unit of electromotive force and can be measured using a voltmeter, and the ohm which is the unit of resistance.
I predict that as the length increases then the resistance will also increase directly proportional to the length. I predict this because I know that the longer the wire the more atoms there are, therefore it is more likely the electrons are going to collide with the present atoms in the wire. This explains the theory that when the length is doubled the resistance is also doubled. This is because if the length doubles it means the atoms double resulting in twice the number of collisions, slowing the electrons down causing more resistance. So, if there is half the length there should be half the resistance and so on. This theory should be illustrated on the graph as a diagonal straight line.
RESULTS
RESISTANCE:
To calculate the resistance divide V (voltage) by I (current)
d.p = decimal place
ANALYSIS
From the graph, I can see a clear trend; the longer the wire the greater the resistance, consequently the shorter the wire the smaller the resistance. I can also see that the length increases approximately proportional to the resistance, meaning that when one doubles so does the other (for example; when the wire is 20cm long the resistance is 2.2Ω and when the wire is 40cm long the resistance is 4.3Ω). This is clear from the graph as the best-fit line passes through the majority of points, also showing a positive correlation.
This is because, as I stated in my prediction; in any given metal wire, there are a number of atoms and free moving electrons. Electricity is the movement of these electrons through the wire. Resistance is caused when the free electrons moving through the wire collide with the atoms making their path through the wire more difficult. This means that if there are more atoms in the way to collide with the free electrons the resistance is increased.
I predicted that; ‘the length would increase directly proportionally to the resistance.’ However from the graph we can see that none of the lengths are directly proportional to the resistances (for example when the length is 20cm the resistance is 2.2Ω, if this was to be directly proportional to the resistance then when the length is 40cm the resistance should be 4.4Ω, however it is 4.3Ω). This may be due to the accuracy in which I performed the experiment or rounding errors which may have occurred when calculating the resistance.
EVALUATION
I think overall, this experiment has been successful, due to the results illustrating what I predicted and that they are theoretically correct, also I do not have any anomalous results. I think that the procedure is reliable because I got a clear spread of results, however if I was to do the experiment again I would measure out the piece of wire to a length of 102cm, so that I could create a more accurate experiment by making sure that there is 100cm in between the clips allowing an extra 2cm at either end where I would measure in exactly 1cm and place the clip there. (This will apply when I decrease the length of wire; 92 cm, 82cm and so on) I think by doing this I will construct a more precise spread of results.
There were two minor problems which I encountered when conducting my experiment, these were; the temperature of the wire; during the experiment the wire became so hot that it started to smoke. However, I knew from previous research that to control the temperature you adjust the variable resistor; therefore this problem was easily solved. Also, during the experiment we had another inconvenience; there was a problem with the voltmeter. Consequently, we had to change the voltmeter half way through the experiment, this, in my mind, created an unfair test so I decided to start the experiment again. It did cause a problem as I had a specific time in which we had to complete the experiment, however, there was nothing I could have done to prevent it and as it happened I completed the experiment within the time.
I think I collected enough evidence to draw a conclusion, I also think that I got a clear spread of results. However, if I was to do this experiment again I might adjust the length of the wire by 5cm each time rather than 10cm, this would give me more results, although I don’t think that by doing this I would prove anything other that what I have already proved.