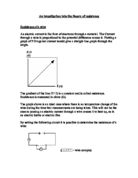
Ohms’ law can be used to work out patterns of resistance, when it is put into practice.
It shows that: 1V draws 1A through the 1Ω resistor
And: 2V draws 2A through the 1Ω resistor
And: 3V draws 3A through the 1Ω resistor
The results show that the current increases in step with the potential difference, in other words, the current is proportional to the potential difference. Provided the temperature remains the constant, the current flowing through a resistor is proportional to the potential difference across its ends.
Factors affecting the resistance of wires:
Some things have a high resistance to the passage of electricity through them, and others have a low resistance. The resistance of any object is fixed but it is difficult to measure it directly. The resistance of an object is found by measuring the current flowing through it when a known potential difference is used.
Resistance depends on material: metal resistors work far better than non-metal resistors as they conduct electricity far better.
Resistance depends on temperature: Heat decreases resistivity because the particles in the heated metal move freely and the electrons can pass much more easily through the resistor, then in a cooler metal with a more rigid structure.
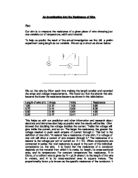
The effect of a shape on resistance: the resistance of an object depends on its length and thickness:
Resistance is higher for a thinner wire: when the wire is thinner there are fewer paths for the current to flow through so the resistance is higher.
Resistance is higher for a longer wire: when the wire is longer there are more obstacles to the flow of the electric current, so the resistance is higher. I have decided to investigate the length of wire, as it is the most practical to look into and will produce the most reliable results.
Prediction:
I predict that as you increase the length of the wire, resistance will increase. I think this because in the case of the longer strip, the electrons will have to get past more particles before reaching the end and so the resistance will be greater.
Preliminary Experiment:
To investigate how the length of wire will affect the resistance, I am going to conduct the following preliminary work to gain an understanding of what equipment and range to use.
Method: set up a circuit with a voltmeter, ammeter, a power pack, crocodile clips and wire. (To control the variable of material I am going to use Nickrome (125g) 26 SWG, diameter 0.457 all through this experiment). Begin with 100cm of wire, place in the circuit using the crocodile clips and measure the volts and amps for this. Repeat the experiment for lengths down to 10cm at 10cm intervals. Record the results.
Results:
Conclusion: From this experiment, I have seen that the range I have used is good and will produce a good graph. However, there were a few problems. I used an analogue ammeter, which meant there were inaccuracies when reading off the level of volts and amps. I also found it was time consuming to work out the resistance for each result, so I have decided to use a mutli-meter for my experiment which would also give much more accurate results. I will also need to do repeats of the readings to gain a fair average.
Circuit diagram:
Apparatus list:
Multi-meter
Connecting wires
Crocodile clips
Length of wire required
Ruler
Detailed plan:
Set up the circuit above
Begin with 100cm of wire, place in the circuit between the crocodile clips and measure the resistance using the mutli-meter and record results.
Conduct this for values of 10cm intervals down to 10cm.
Repeat each value 3 times to gain an average
To keep the other variables the same, make sure the experiment is kept constant at room temperature, the same wire is used throughout (Nickrome (125g) 26 SWG), and that the same width of wire is used (diameter 0.457).
Risk assessment:
To sustain safety, it is important to consider that there is electricity in use. Always turn off plugs at the socket before removing them, and be weary of old wires that may be damaged as these could be unsafe and could pass electricity through you if touched. Although it is not going to be a danger in this experiment directly, keep water away from electrical items and sockets.
Secondary sources: ‘Science in Physics’ – John Byron
‘Key Science’ – Jim Breithaupt
‘SEG, Physical Processes’ – Richard Parsons
Results:
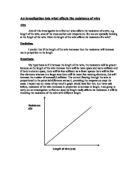
These results can be displayed clearly in a graph (see graph paper).
As can be seen from the results, as the length is decreased the resistance decreases also. In other words, this means that the more wire, the more resistance there is in the circuit. There is a strong positive correlation. For example, when the length of wire is decreased from 100cm to 90cm, the resistance decreases from 7.1Ω to 6.3Ω, a difference of 0.8Ω.
Conclusion:
To conclude, it can be seen that as the length of wire is decreased, the resistance also decreases. This can be explained by that fact that a longer wire holds more resistance, as there are more obstacles to the flow of electric current. As can be seen from the graph, there is a trend to the results. The graph has a positive correlation and the straight line suggests that there is direct proportionality between length and resistance (R ∝ L). This can be used to understand the results produced using the equation. The two lines of results are proportional to each other because the lines are parallel. These results were concluded by:
Diameter of wire = 0.457, therefore Radius of wire = 0.2285
Constant = 1.07 x 10⁻⁴ cm at room temperature
Resistance= constant x length/area of cross section
= k 100/πr 2
= k 100/π0.2285 2
= k 100/ 0.164
= 1.07 x 10-4 x 100 / 0.164 (cm)
= 1.07 x 10-4 x 100 / 0.00164 (cm)
= 6.52Ω
This equation does not account for contact resistance, so the straight line produced goes through the origin.
My results back up my prediction, as I predicted the resistance would increase if the length was also increased because of the fewer obstacles in the electric currents’ path. The results produced are reliable because
Evaluation:
Accuracy: The results are pretty reliable. This is based on the fact that they run in correlation and are in parallel to the equated results, and that we made 3 repetitions each time to gain a fair average. There is however still the possibility of mistakes although there could not be anything too drastic, as this would have shown up in the results graph. There could have been mistakes made with the accuracy of the wire length when cutting it. The wire may not have been taught when measuring it against the ruler thus producing a slight inaccuracy in the resistance. To make it more accurate, values could have been measured to more decimal places.
Anomalous results: I did not have any anomalous results to my data apart from the few discrepancies that may have occurred with the measuring of the wire.
Changes: there are few changes that could be made to improve the results produced from this experiment as the results are pretty accurate already, but a larger range of results could be an improvement, and also more attempts at the same value could produce a fairer average. Measuring the wire for every 5cm could also make readings more accurate.
Is the evidence enough to support a conclusion? This evidence is enough to support a conclusion about the affect the length of wire has on resistance, but not about the affects that all factors affecting resistance have.
Further investigations: obvious investigations that could be carried out after this would be to look into and test how the other factors affect resistance in a circuit. This would then provide enough evidence to support a conclusion on resistance.