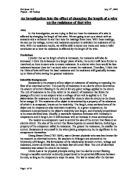
Ohm’s Law can be abbreviated to a simple formula triangle:
In a circuit, you would usually measure the voltage and current using a voltmeter and an ammeter and then work out the resistance afterwards using this formula triangle. You can measure the resistance straight away by using an ohmmeter, but they are very rare and cost a lot of money so it’s easier to calculate the resistance afterwards.
Equipment:
- A power pack
- An ammeter
- A voltmeter
- Various lengths of constantan wire with diameter of 0.5588mm (SWG of 24)
- Crocodile clips
- Wires
Method:
- Plug the power pack into the electrical socket and set the voltage to 4.
- Connect one end of a wire to the + on the power pack and the other end to the – on the ammeter.
- Connect another wire to the + of the ammeter and put a crocodile clip on the opposite end of the wire.
- Clip the crocodile clip onto one end of the constantan wire.
- Attach the other end of the constantan wire to another crocodile clip and put the crocodile clip on the end of a different wire.
- Connect the end of the wire, without the crocodile clip on, to the – on the power pack.
- Put two separate wires into the + and – terminals of the voltmeter and place a crocodile clip on the opposite end of each wire.
- Finally, clip the crocodile clip from the + terminal of the voltmeter onto the crocodile clip that is connected to the ammeter and clip the crocodile clip from the – terminal of the voltmeter onto the crocodile clip that is connected to the – terminal of the power pack.
- Turn on the power pack, the ammeter and the voltmeter and record the readings from the ammeter and voltmeter in a table.
- Repeat steps 1-9 for the other four lengths of wire.
- Repeat the whole experiment to get more results so that an average can be found which will make your results more reliable.
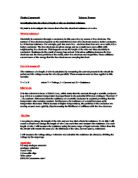
Circuit Diagram:
When your circuit is complete, it should look like this:
Variables:
Range and repeats:
In this experiment, I plan to measure the voltage and current of five different wire lengths with equal intervals in between. I’m going to use 10cm, 20cm, 30cm, 40cm and 50cm of constantan wire in the experiment. I also plan to repeat the experiment three times with each length of wire. Repeating the experiment will give me more results with which I can calculate an average and so get more reliable data.
I plan to record the voltage and current in the circuit and then calculate the resistance by using the formula triangle invented by Georg Ohm. When I know the resistance I can plot a graph of the results and make valid conclusions about my data in order to help me prove or disprove my prediction.
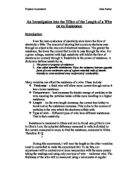
Pretest:
In my pretest, I conducted the experiment slightly differently. The set up of the equipment was exactly the same, but the aim of my pretest was to find a suitable wire with a suitable diameter to use for the real experiment. I tested several wires and noted the currents and voltages of them so that I could then calculate their resistance’.
These are the results that I collected:
I then used these results to help me select an appropriate wire to use for the real experiment. As you can see from the results, nickel chrome and constantan (SWG of 36) had the highest resistance. Usually, I would have used one of these wires in the final experiment because they both have high resistance and so they would both be good for my experiment. However, while conducting my pretests, I noticed that when I used nickel chrome and constantan (SWG of 36), both of the wires got very hot and I had to let them cool before I could remove them from the crocodile clips without burning myself.
The reason I chose to use constantan (SWG of 24) was that it was the wire that had the most resistance, but wouldn’t get hot. I couldn’t use the other wires because they got too hot to touch and if they didn’t burn me or the bench I was working on, they would certainly have slowed down my experiment by making me wait for them to cool before I could repeat the experiment.
Apart from the adjustment to my aim, the way in which I conducted the pretest and the real experiment and the way that I set up the equipment were identical.
Results:
These are the results that I obtained from the real experiment. I have entered the results from the three repeats that I did. I have then calculated the resistance for each one of the results by dividing the voltage by the current. After doing that I worked out the average current and voltage. From the averages I then calculated the average resistance.
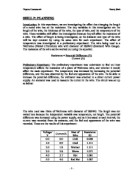
Graphs:
Conclusion:
These three graphs show the separate results for the current, the voltage and the resistance in the wire when we conducted the experiment at different lengths. I calculated the averages in my table and plotted them on to the graph. Each of the three graphs show something different.
The first graph for the current flowing through the wire shows a negative correlation. This means that the points slope downwards from left to right. I have drawn a curve of best fit on the graph, which goes through two points and is very close to the other three points. From the curve, you can see the trend more clearly and you can see that the current is larger in a smaller wire than it is in the longer wire. The current is 0.94 amps in the 10cm wire, but only 0.52 amps in the 50cm wire. This is a big difference and shows that the current decreases when the wire length is increased.
The second graph for the voltage through the wire shows a positive correlation. This means that the points slope upwards from left to right. I have drawn a curve of best fit on the graph, which goes through three of the five points that I plotted. The trend in the graph is easier to see with the curve of best fit and it shows that the voltage is smaller in the smaller wire than it is in the longer wire. The current is 0.19 volts in the 10cm wire and increases to 0.52 volts in the 50cm wire. This difference in voltage between the two lengths of wire shows that the voltage increases when the wire length is also increased.
The third and final graph shows how the resistance of the wire varies with the wire length. This graph also has a positive correlation, but it is a much stronger one than on the voltage graph. Because the correlation is so much stronger, I have been able to draw a line of best fit rather than a curve and still keep all of the points either on or very near to the wire. The line goes through almost all of the points, and the one that it doesn’t go through is only a fraction off it. From the line of best fit, you can also see that the length of wire is directly proportional to the resistance of the wire. As the length of the wire was increased by 10cm, the resistance of the wire increased by about 0.2Ω. Some increased by 0.21Ω or by 0.19Ω, but they were all about 0.2Ω.
In conclusion, I have found out that the current decreases as the length of wire is increased, the voltage increases as the length of wire is increased and the resistance is directly proportional to the length of wire, meaning that they both increase together to form a straight line through the points.
By looking at the results that I obtained from experiment and by examining the graphs, you can clearly see that the prediction I made ties in with my results and graphs. My prediction stated that 10cm of wire would have the least resistance and the resistance would gradually increase so that 50cm of wire had the highest resistance. From the results, you can see that the 10cm wire had a resistance of 0.21Ω and then it increased by about 0.2Ω every 10cm of wire with the 50cm piece of wire having a resistance of 0.99Ω. By looking at the graph, the lowest point is at 10cm and the highest point is at 50cm and there is a straight line that joins these two points so the resistance does gradually increase, as I stated in my prediction.
Evaluation:
I think that all of my results are accurate. All of the results on the three graphs either touch or are very near to touching the line or curve of best fit. On the resistance graph, all of the points are actually touching the line of best fit and they all follow in order with roughly a 0.2Ω gap in between each point. I don’t think there are any big anomalies that are miles away from the trend line, but the current and voltage for the 20cm piece of wire are slightly off the line. The result for the current (0.77amps) was slightly higher than the curve of best fit and the result for the voltage (0.31volts) was slightly lower than the curve of best fit. Because both of the results were slightly off the curve, they affected the resistance calculation because they were both used to determine the resistance of the 20cm piece of wire. Because both these results were slightly off the curve, this explains why the resistance for the 20cm piece of wire is just off the line of best fit for the resistance graph.
The reason for these slight anomalies could be one of many. When we conducted the experiment, we didn’t leave long in between the different measurements and so the wire could have been slightly hotter when we took the 20cm measurements. It could also have been that we didn’t get the measurement quite right. Because the wire was coiled round a cylinder, when we cut our required lengths, there were twists in the wire and it wasn’t completely straight. This could have meant that we actually cut more wire than we were supposed to. We might have ended up with about 23cm of wire instead of 20cm. Although 3cm doesn’t seem a lot, it could have affected our results significantly.
Suitability and limitations of method:
Overall, I think that the method of collecting and recording the results that we used worked very well. While we were conducting the experiment, nothing went wrong and we managed to repeat the experiment three times in a very short space of time.
However, if I were to redo the experiment, then I would change two things. The first thing that I would change would be the time left in between taking each measurement. When we conducted the experiment we were short of time and so we didn’t leave very long in between each measurement. This may be the reason why the results for 20cm of wire were slightly off the curve of best fit. The wire might have been hot from the first measurements we took and this could have affected the results that we obtained. If I were to change this, I would leave a set amount of time, probably about 2 minutes, between taking each measurement so that the wire had chance to cool down and we could get even more accurate results.
The other part of the method that I would change would be to do with the wire. The wire that we used was from a coil that was wrapped around a plastic cylinder. When we removed the wire from the coil it was twisted and bumpy. To conduct the experiment properly and ensure that we had exactly the right length of wire we would need to flatten the wire before using it. In order to make the results more accurate I would flatten the wire so that I had a complete straight line with no bends or twists in it to adjust the length. By doing this, we could get more accurate lengths of wire and thus increase the accuracy of our results.
Every other part of our method worked really well and I would leave it the same if I were to repeat the experiment another time.
Reliability:
I think my results were extremely reliable because we repeated the experiment three times and all three measurements that we took were very close together. Most of the repeated measurements were within 0.2 or 0.3 of the first measurement. There were a few that were slightly larger or smaller than the first measurement, but they are very unlikely to all be identical to each other. There was only one measurement that was quite far apart and that was for the current going through 10cm of wire. The lowest measurement was 0.9 amps and the highest was 1.0 amps so the difference was 0.1 amps. This was the biggest difference in my whole experiment and therefore I think my results are very reliable.
I feel that my results are very reliable and that they are sufficient enough to support the conclusions that I made from them about the trends of the current, voltage and resistance. Because my results are sufficient enough to support my conclusion, they also prove my prediction to be correct.
Further Experiments:
If I were to do further research into the resistance of wires and how the length of the wire affects the resistance then I would probably test different wires. In this experiment, I only tested the 0.5588mm constantan wire. This gives me enough data to draw conclusions about this wire, but I cannot make any conclusion about the resistance of other wires compared to their length. If I wanted to find out more about the resistance in wires then I would test the other wires that I used in my pretest like nickel chrome and copper. I would conduct the experiment in exactly the same way and use the same lengths of wire. The reason I would do this is so that I could compare the results that I got from these wires with the results that I already have from the constantan wire. With these results I could then draw conclusions not just about the resistance compared to length, but also about the resistance compared to the diameter of the wire. On the graphs that I produced, I would plot diameter of wire along the x-axis and the resistance along the y-axis and then just plot the resistance’s of wires of the same length. I would draw five graphs, one for each of the wire lengths, and then compare them all with each other to be able to draw conclusions about more than the length against the resistance.