The above table and the accompanying graph from my preliminary test will give me a rough and brief, scaled down guide to what my real results should look like and provides a benchmark for my results. It also illustrates that the more concentrated the hydrochloric acid is, the faster the rate of reaction was and the faster the cross disappeared. Also, on my graph there is a positive correlation, with the concentration and the rate of reaction being inversely proportional, this is something I expand on in my prediction and predict to happen in my real test. I have also found that my method of experimentation of repeating each test three times and calculating an overall average is a good one because as illustrated by my preliminary graph it has provided me with accurate and reliable results. I will follow this method in my real test. I have now also realised it is best to place the paper with the cross on inside of a plastic wallet to prevent it from becoming wet.
Prediction
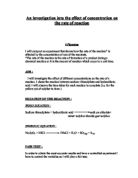
I predict that as the concentration of the hydrochloric acid increases the rate of reaction will also increase and so the faster the chemical reaction will take place. Therefore, the cross will disappear more quickly due to the cloudiness of the solution. Also, I believe reducing the concentration will have the opposite effect. The less concentration involved, the longer it will take for the solution to become cloudy and the cross will stay visible for longer.
I think the concentration of a solution affects the rate of reaction in this way because the rate of reaction depends on how frequently the molecules of the reacting substances collide. A more concentrated solution has more molecules for a given volume than a more dilute substance and so because there are more molecules about, the frequency of successful collisions is greater, and the reactions happen faster. This prediction is backed up with the results from my preliminary work where I found that the higher the concentration of hydrochloric acid the faster the reaction will be.
I furthermore predict that the graph of results drawn up will have a positive correlation. I think this because referring back to the collision theory; it says that before colliding molecules react, they must have an energy equal to or greater than the activation energy for the reaction. I also predict that the graph will probably be curved, as the increase in the rate of reaction will not be exactly the same as the concentration is increased. These predictions are furthermore backed up by my graph from my preliminary work, which has a positive correlation and a curved line of best fit. I predict that the graph will look like the one from my preliminary work – this is on a separate sheet.
Fair Test
In order to receive some reliable and accurate results I will have to make sure I conduct a reasonably fair test. Firstly, we need to keep a chemical at a constant concentration so that the results are reliable in every case. So, in this experiment we have chosen to keep sodium thiosulphate at a constant concentration. Next we must make sure that the hydrochloric acid and the sodium thiosulphate solution is kept at a constant volume throughout the experiment. If the volume is different, then it could give different results to if it was at a constant volume and consequently make the results highly unreliable. To account for fair results we must start the stop watch at the exact time as we put the hydrochloric acid and the sodium thiosulphate into the conical flask. To do this it is a lot easier if there are two people doing the experiment, so one person can put the two substances in, and one person can start the stop watch. To make a fairer test I think there must only be one person who delegates when the watch starts and when its ends, for different people have different eyes. So in this case I will make sure that the same person records the time for each individual test. Also, the person timing the experiment will look for the disappearance of the cross, otherwise there would be a time lapse between seeing the cross disappear and telling the other person to stop the clock and then eventually stopping the clock. To account for more of a fair test I should try to ensure that all other factors affecting the rate of a reaction were kept constant, as these obviously could alter the rate of reaction. There is not too much I can do about this, however, I will be doing all of my experiments in the same room, in order for me to keep the temperature of the experiment constant. Another thing I must do is make sure that the conical flask is completely clean and free of any water or any other substance before we attempt to start the next experiment – any other foreign substances could influence the outcome of the experiment.
Safety Precautions
There are a few safety precautions that need to be taken into consideration in this experiment. The main precautions I can think of are stated below:
-
Wear safety goggles at all times during the experiment to protect the eyes from chemicals as things are very unpredictable, and even though it is very unlikely that the solution would come out of the conical flask during the experiment, one must still be cautious of spills.
- Keep bags and stools under the bench to allow a better and safer working environment.
- Stand at all times when conducting the experiment to reduce the risk of tripping and spilling chemicals.
- Take care when using the chemicals and equipment during the experiment - especially the hydrochloric acid as it can irritate the skin upon contact.
- The experiment should take place on a flat, level and stable surface, like a table, to prevent spillages.
- Make sure equipment is not damaged or broken.
Collecting results and starting the experiment
I am now ready to undertake my experiment. I will record my results from my experiment in a results table, the same as the one in my preliminary test but a larger version because I only took a few concentrations for my preliminary test. In the results table I will record the data from the chosen concentrations of hydrochloric acid (10 different concentrations ranging from 0.1 molars to 1.0 molars). I will repeat the test for each concentration three times and then find an average rate of reaction time for each concentration – this should provide me with more accurate and reliable results. I will then illustrate my results in my results table by plotting them on a concentration and rate of reaction graph. The results table and my concentration and rate of reaction graph are both on separate pages.
Analysis and conclusion
From my results I have discovered that as you increase the concentration of the hydrochloric acid solution, the faster the rate of reaction is. This means that the precipitate will form quicker if there is a higher concentration and so the cross will disappear faster. Also the same is true for the opposite, as you decrease the concentration of hydrochloric acid, the slower the rate of reaction is, in other words the lower the concentration of the hydrochloric acid, the longer it takes for the precipitation to form and the cross to disappear. Therefore, after performing my experiment a conclusion can be drawn which states that, if the concentration in a reaction is increased, the rate of reaction will increase, resulting in the fact that the more concentrated the solution, the faster the rate of reaction. This is illustrated in my results table and also on my concentration and rate of reaction graph, which illustrates that as the concentration is increased, the rate of reaction increases and vice versa such as that as the concentration is decreased the rate of reaction decreases. For example, when the hydrochloric acid was at a concentration of 0.3 molars (M) it took on average 147.5 seconds for the cross to disappear, compared to when the hydrochloric acid was at a higher concentration of 0.5 molars it took less time, 137.5 seconds for the cross to disappear. Moreover, with the lowest concentration (0.1 M) it took on average 161 seconds for the cross to disappear, whereas, with the highest concentration (1.0 M) it took 126.3 seconds for the cross to disappear – 34.7 seconds quicker. Therefore, these results support the conclusion that the higher the concentration, the faster the rate of reaction is. I have also in turn proved the part of my prediction in which I predicted that as the concentration of the hydrochloric acid increases the rate of reaction will also increase and so the chemical reaction will take place faster and so the cross will disappear more quickly due to the cloudiness of the solution. All of this is due to the scientific theory in which I explained in the background information, in which I explained that by increasing the concentration of hydrochloric acid there are more reactant particles per unit volume. This increases the probability of reactant particles colliding with each other and therefore increases the speed of precipitation forming. From my results I have shown that this is true. When we say the concentration affects the time for the precipitation to form we mean that when there is a higher concentration there is physically more of the particles. In this case there would be more hydrochloric acid particles (2HCL) to react with the sodium thiosulphate particles (Na2S2O3), and therefore it takes less time for the precipitation to form and the cross to disappear, as shown by doing the experiment and drawing the graph. I have also proved the part of my prediction right in which I predicted that my concentration and rate of reaction graph would show a positive correlation and would be curved. My graph has a positive correlation because referring back to the collision theory; it says that before colliding molecules react, they must have an energy equal to or greater than the activation energy for the reaction. Furthermore, my graph is curved, because the increase in the rate of reaction will not be exactly the same as the concentration is increased. My conclusion supports my predictions almost entirely, in that they show that the rate of reaction decreased as the concentration was increased, and that the graph has a positive correlation and is curved as predicted, although, there are three slightly anomalous results which stray from the pattern made by the curved line of best fit, however, these results are very close to the line of best fit and so do not affect the overall pattern of the curved graph in which I predicted earlier on and so it seems the conclusion sufficiently supports the predictions in which I made. I believe that my results are correct and reliable as they follow a similar and distinctive pattern to the results of the other groups in my class. For example, when they plotted their results on a graph, their graphs all had the similar distinctive curve and a positive correlation, with the rate of reaction increasing as the concentration is increased and vice-versa. Also, I believe I was correct as secondary sources in school chemistry books state that the reaction time will be faster with a more concentrated solution because, the more molecules there are, the frequency of successful collisions is greater and therefore the reaction rate is speeded up.
Evaluation
I believe my experiment was fairly accurate, because the majority of the results followed the pattern, as shown by the line of best fit on the graphs. From my graph I can see that my results that I collected are quite reliable. I know this because all of the ten points or readings on my graph lie either on or close to the line of best fit. As illustrated by my graph there are only three slightly anomalous results as such, but these are very close to the line of best fit. For example, at 0.3 molars, 0.5 molars and 0.8 molars the results stray from the line slightly, but at most this is only by as much as 1.5 seconds. Although there are these slight anomalies, they are not far from the line of best fit, showing the pattern of the results, so I still think my result are fairly reliable. However, these slight anomalies may be due to a number of things. For example, there may have been a human error involved such as when looking for an end point in the reaction - although the reaction I chose had a fairly definite end point it was still hard to tell whether the whole cross had disappeared or not and so I may have miscalculated the reaction time with the stopwatch on several occasions, resulting in slight anomalies. Also, I may not have been consistent in measuring the exact same volume of hydrochloric acid and sodium thiosulphate for each test, and so if the volumes were not kept constant, the slightest mistake could influence the results, such as that measuring a bit too much of the solutions would increase the rate of reaction and give slight anomalies – this is what seems to have happened on three occasions, as illustrated on my graph.
-
Further checking the reliability of results – Percentage error:
To check how accurate my results are that are plotted on my graph in relation to the line of best fit, I can calculate the percentage error; this will tell me how accurate each result is accordance to the line of best fit in the form of a percentage – the lower the percentage the more accurate the result is.
The percentage error can be calculated using the formula:
Origional reading - Line × 100 Line
I can now calculate the percentage error of all of my ten readings on my graph. I will first start at the concentration of 0.1 molars (M) and work through to the concentration of 1.0 molars (M).
-
0.1 Molars: 0.1 – 0.1 × 100 = 0% error 0.1
-
0.2 Molars: 0.2 – 0.2 × 100 = 0% error 0.2
-
0.3 Molars: 0.3 – 0.275 × 100 = 9.09 = 9.1% error (1.d.p) 0.275
-
0.4 Molars: 0.4 – 0.4 × 100 = 0% error 0.4
-
0.5 Molars: 0.5 – 0.49 × 100 = 2.04 = 2% error (1.d.p) 0.49
-
0.6 Molars: 0.6 – 0.6 × 100 = 0% error 0.6
-
0.7 Molars: 0.7 – 0.7 × 100 = 0% error 0.7
-
0.8 Molars: 0.8 – 0.78 × 100 = 2.56 = 2.6% error (1.d.p) 0.78
-
0.9 Molars: 0.9 – 0.9 × 100 = 0% error 0.9
-
1.0 Molars: 1.0 – 1.0 × 100 = 0% error 1.0
These percentage error results illustrate that my results are very accurate in accordance to the general pattern of the results set by the line of best fit. There is a 0% error on all of my results except for the three that are slightly anomalous. However, from my percentage error results I can see that they are quite accurate with the largest percentage error being 9.1%.
Therefore, I believe that the reliability of my experiment is very good and is more or less sufficient to support my conclusion. I think this because as illustrated by my graph all of the points are either on the line of best fit or are very close to it and so they all follow the same general pattern in my results. Also, my percentage error calculations illustrate that nearly all of the results on the graph had a 0% error and so cannot be more reliable. There was only three results that did not have a 0% error, one having a 2% error, another having a 2.6% error and the highest having a 9.1% error, however, these three results are also somewhat reliable too as they are not very far off the pattern made by the line of best fit. I further believe the results are reliable enough to support the conclusion because my results follow the same trend and pattern as the other groups in my class. Therefore, they must be fairly reliable if other groups doing the experiment have the similar distinctive curve as that on my graph.
I believe the method of experimentation in which I used in finding three sets of results and finding an average rate of reaction, though time consuming (30 different results) accounted for more accurate results and because of this I believe it was a suitable procedure. Therefore, I believe the overall accuracy of my results is reasonably good and this is illustrated on my graph which shows a smooth curve in which I predicted, with all of the results either touching or are very close to the line of best fit. I believe my experiment went quite well, everything went as planned and I received roughly the results I expected. My preliminary work helped, after the preliminary work I was able to see what the results should roughly look like and what I would need to change for my final experiment. As previously stated in the preliminary work, I realised it was best to place the paper with the cross inside a plastic wallet to prevent it from becoming wet and making the cross fade – which would also affect my assessment of the cross disappearing.
Some areas in the experiment that I feel I could have improved on were factors like controlling the stopwatch - although the reaction I chose had a fairly definite end point it was still hard to tell whether the whole cross had disappeared or not. Instead of using a cross a light beam could be used and when the beam goes out that is the end point. There is also room for improvement in measuring the amount of sodium thiosulphate and hydrochloric acid more precisely. There is lots of room for human error here. Also, although I made my measurements to a fair degree of accuracy, they could be made more accurate by measuring the time to 2 decimal places instead of 1 decimal place. I could also improve the accuracy by doing each test 5 times instead of 3, to get a fairer average, though this would be time consuming.
Further Work
Further experiments I could do which are related to the rate of reaction would be to see whether the following factors would make a difference to the rate of reaction: (I have made a prediction for each factor from my own scientific knowledge on how I think the resistance would change in a wire for that particular factor):
" Temperature:
I think that if the temperature is increased the rate of reaction will increase. I think this because the temperature alters the rate of a reaction by supplying the reactant particles with more energy, the more energy the reactants have the faster they move around increasing their chance of bumping into one another and having a successful collision. Also the more energy they get from the heat the more particles have enough energy to react, this is known as activation energy.
" Surface area (of solids):
I think that if the surface area (of solids) is increased the rate of reaction will increase. This is because a larger surface area will increase the probability and will result in more collisions between the particles and the solids and so this will release more energy and increase the rate of reaction.
"Pressure (in gasses):
I think that if the pressure was increased the rate of reaction would increase. This is because if the pressure is increased the particles in the gas are pushed closer. This increases the concentration and the likelihood of collisions and thus the rate of reaction.
"Catalyst:
Catalysts increase the rate of reaction without themselves being used up or chemically changed. Catalysts work by lowering the activation energy barrier, this means more reactants can begin to react sooner to turn into the products. An example of a catalyst is manganese dioxide powder; this speeds up the breakdown of hydrogen peroxide into water and oxygen.
There are also a number of things that I could do to improve my results or even provide myself with a new, more accurate set of results. As I said, I could have used a light sensor, which would have given me more accurate and precise results as this may be more accurate than my own assessment of the cross disappearing. The other thing I could have also done was to carry out the experiment more than three times. For example, I could have performed it five times in order to get more reliable averages.