Results:
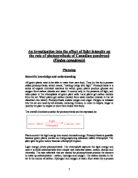
Graph:
Analysis:
The trend in my graph shows that as the distance from the light source increases the average number of bubbles produced increases too. I can see this as there is a positive correlation on my graph and the average number of bubbles produced for 5cm was 16.33 and for 20cm it was 37.
The process of photosynthesis is used to make food in plants. The formula for this process is:
Carbon Dioxide + Water Glucose + Oxygen
6CO2 + 6H2O C6H12O6 + 6O2
Photosynthesis takes place in the leaves of the plant.
Carbon dioxide is obtained from the surrounding environment. It diffuses into the leaf from the stoma pores on the underside. Carbon dioxide increase the rate of photosynthesis until it reaches a threshold level, where the rate becomes limited by another factor.
This graph shows the effect of carbon dioxide
on the rate of photosynthesis
Water is delivered from the roots to the leaf via the xylem tube. It is obtained by the roots under the ground. Water, similarly to carbon dioxide, increases the rate of photosynthesis and it also reaches a point where it doesn’t increase it anymore, because it is limited by another factor.
This graph shows the effect of water
on the rate of photosynthesis
Glucose is a product of photosynthesis. It’s is used for respiration in plants. As well as that glucose is a plants source of food. It’s transported around the plant in the phloem vessel. The glucose that is not required is stored as starch in the leaves for use later on.
Oxygen, like glucose is also a product of photosynthesis. However, most oxygen is released back into the surrounding environment. The oxygen that isn’t, is used for respiration.
The temperature also affects the rate of photosynthesis, however if the temperature goes over the optimum temperature the enzymes start to denature, breaking the bonds, and slowing down the rate of photosynthesis until it comes to a complete stop.
This graph shows the effect of the temperature on
the rate of photosynthesis
Chloroplast is the most important organelle in plants for photosynthesis. It is found in mesophyll cells and it contains green chemical called chlorophyll which converts energy from the sun into chemical energy which is used in photosynthesis. The chlorophyll absorbs all white light apart from green, which it reflects as the chlorophyll is green.
Light is very important for photosynthesis. It is the main supply of energy. The speed that light increases the rate of photosynthesis at, depends on the colour of the light from the spectrum. The rate of photosynthesis is at its best when there is red, orange or yellow light present. That is why in autumn the rate is very low because the leaves are a red, orange or yellow in colour, because the chlorophyll pigment has broken down leaving the more weaker chemicals like xanthophyll which reflect the red, orange and yellow instead of absorbing it. Also as photosynthesis is at its best in red, orange and yellow light it is very poor in green, as the chlorophyll is normally green in spring and summer, when light intensity is at its highest, therefore it reflects the light. As well as green light the rate of photosynthesis is poor in blue and purple light, but not as slow as green light. This is because the blue and purple are very close to the green light therefore it is not as good as red or orange light.
This graph shows the rate of photosynthesis
in the different colours of white light
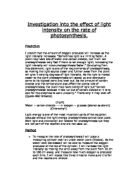
As the light intensity increases so does the rate of photosynthesis. However it then gets to a point where the chloroplasts are working as hard as they can, absorbing as much light as possible and even if the light intensity increases the rate of photosynthesis does not. This is also where the speed is limited by another factor.
This graph shows the effect of light intensity
on the rate of photosynthesis
I have found that my prediction was wrong as the rate of photosynthesis actually increased as the distance from the light source did. However, I know that this was wrong
Evaluation:
I have one anomalous result on my graph. I think this is because that the piece of elodea used was nearly dead and therefore most of the chlorophyll in the plant had broken down, so the plant didn’t absorb all the light. Therefore the reading it gave was lower than the other three
The problems I found were that the elodea had some pieces with dead leaves. Also I found that using different pieces of elodea each time meant the amount of oxygen produced depended on the number of leaves. I found that his affected my results as the number of oxygen bubbles may have dropped as a result. Also the measurement of a spatula of sodium hydrogen carbonate was different for each spatula-full, so there could have been more or even less than the stated amount put in. Apart from the sodium hydrogen carbonate having different measures the water did too, as the boiling tube was filled up each time, this made the experiment unfair because one piece may have had more water than another. As well as that there could have been some contamination in the apparatus used. This could have reacted with something like the water or sodium hydrogen carbonate therefore I didn’t get as much carbon dioxide produced. Also the contaminated equipment could have changed the pH of the water affecting the effectiveness of the enzymes. As well as that I found there is human error in counting the number of bubbles. This means that there could have been too many or too little bubbles counted, this again affecting the outcome of my results. Also the temperature off the room wasn’t always at a constant level therefore again effecting the enzymes whose productivity would fluctuate. Furthermore the light that was used could have been very weak therefore not allowing the chlorophyll to reach the highest rate of photosynthesis possible. Plus some of that light could be reflected so there is less light available for the plant to photosynthesise.
If I do the experiment again I would take more readings to get my average also I would make sure that the elodea is in better condition before I use it. As well as that I would use the same cutting instead of taking a different one each time as this would make my results more accurate as all the reading would be from the same piece of elodea, instead of different pieces which would have a different number of leaves giving me readings depending on the number of leaves on that plant. Next time I would have weighed out the amount of sodium hydrogen carbonate I was going to use so that I put the same amount in each time. Also I would have measured out the amount of water to be used and then put it in the boiling so that, that is also accurate. As well as that I would have rinsed out the boiling tube a cleaned the spatula so that there is no contamination and that the pH of the water isn’t affected. Furthermore I would get more than one person counting the number of bubbles that are produced and then take an average of what they get for each experiment or I would set up a computer so that it counts the number of bubbles that are produced, however that it a lot more complicated. As well at that if I do the experiment again I would check that the light is working properly and that it is shining as brightly as possible. Also next time I would do the experiment in a trough and have the light shining over the top so that it has only one medium to travel through and less light it lost due to reflection.
An alternative experiment that I could use is to test the pH of the sodium hydrogen carbonate solution at the start and end of the experiment. For this experiment I would add 0.5 grams of sodium hydrogen carbonate into a trough of water. I would then stir the solution and take the pH by using litmus paper or universal indicator, it should be pH14 or thereabouts. I would then add the piece of elodea. I would then place the lamp so that it shines down on the plant limiting the amount of light that is reflected. After 20 minutes I would check the pH once again and the closer it is to pH7 the more it has been photosynthesising.