Chelsea Forrest
The aim of this experiment is to find out how sucrose concentration affects osmosis in potatoes, using different sucrose concentrations over a set period of time.
There are many different variables for this experiment. The independent variable is the change in sucrose concentration, and the dependant variable is the change in mass. Time, volume of sucrose solutions, surface area, and the starting mass of the potato are all control variables:
This is how the experiment will be carried out:
*ALWAYS BORE THE POTATO ONTO A WHITE TILE*

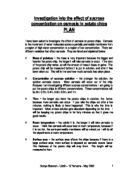
- Measure 30cm of each sucrose concentration (in this case 0m, 0.1m, 0.2m, 0.3m 0.4m and 0.5m). Place each different one in a different cup.
- Boer 12 pieces of potato, and cut them roughly the same length.
- Weigh all the pieces of potato. Get them as near to 1.15g as possible, and make sure that there are pairs of weights (eg. 2x1.14g, 2x1.15g etc. not 1x1.14g, 1x1.13g, 1x1.15g etc.)
- Place the pairs of potato in the different sucrose solutions (1 pair/solution) as in diagram below:
- Leave for 22hrs 30 mins.
- Take out the potato ...
This is a preview of the whole essay
- Measure 30cm of each sucrose concentration (in this case 0m, 0.1m, 0.2m, 0.3m 0.4m and 0.5m). Place each different one in a different cup.
- Boer 12 pieces of potato, and cut them roughly the same length.
- Weigh all the pieces of potato. Get them as near to 1.15g as possible, and make sure that there are pairs of weights (eg. 2x1.14g, 2x1.15g etc. not 1x1.14g, 1x1.13g, 1x1.15g etc.)
- Place the pairs of potato in the different sucrose solutions (1 pair/solution) as in diagram below:
- Leave for 22hrs 30 mins.
- Take out the potato chips, and roll them over a paper towel to soak up excess solution.
- Re-weigh potato chips
- Calculate percentage in/decrease by using the formula below:
Difference in new and original masses x 100
Original mass
- Make a table (like the one below) to record the results, and work out a mean average for each solution.
Then plot the results on a graph, and draw a line of best fit. Identify any anomalies.
A preliminary investigation has been done of this experiment. This has helped me predict the outcome of my experiment, and helped me set it up. In the preliminary, I only used 3 different sucrose concentrations, and I found that this wasn’t accurate enough. It also helped because I knew how to set up the experiment and what areas I had difficulty with. In the preliminary experiment, I measured length gained/lost, but I have decided to do mass for this experiment as it is more accurate and has less chance of human error. My preliminary also helped me decide what concentrations of sucrose to use, as I wanted to concentrate on the area in which there was not much mass loss/gained.
Using my preliminary experiment as a guide, I predict that there will be mass gained at the lower sucrose concentrations, and a mass loss at the higher sucrose concentrations. I think that there will be no mass gained/lost at around 0.2-0.3m. I think this because osmosis is the movement of water down a water potential gradient, so when there is a low sucrose concentration, there is a high water gradient
I also think that when the water moves into the potato the cells will become turgid, and therefore the potato will become firmer.
I think that, at the higher sucrose concentrations, the opposite of what I have described will happen (i.e. the water will move out of the potato, and therefore mass will be lost, and the potato chip will become flaccid and soft).
This is a graph of what I predict will happen. I think that the water gradient is roughly the same around 0.3m of sucrose. I have predicted this with the aid of my preliminary results.
This is how I carried out the experiment:
*ALWAYS BOER THE POTATO ONTO A WHITE TILE*
- Measure 30cm of each sucrose concentration (in this case 0m, 0.1m, 0.2m, 0.3m 0.4m and 0.5m. Place each different one in a different cup.
- Boer 12 pieces of potato, and cut them roughly the same length.
- Weigh all the pieces of potato. Get them as near to 1.15g as possible, and make sure that there are pairs of weights (eg. 2x1.14g, 2x1.15g etc. not 1x1.14g, 1x1.13g, 1x1.15g etc.)
- Place the pairs of potato in the different sucrose solutions (1 pair/solution) as in diagram below:
- Leave for 22hrs 30 mins.
- Take out the potato chips, and roll them over a paper towel to soak up excess solution.
- Re-weigh potato chips
- Calculate percentage in/decrease by using the formula below:
Difference in new and original masses x 100
Original mass
After the experiment I had to dry the potato chips as well as possible. I did this by rolling them on a paper towel. I had to do this so that I could be sure that all mass gained was from osmosis, and not excess water on the potato chips. I also “zeroed” the balance every time I weighed a potato chip, so that any excess water on the balance did not affect my results. These are my results:
Difference in original and new masses x 100
Original mass
*Graphs of these results are on the next 2 pages*
The results show 2 different trends. Trend 1 is above the x-axis where an increase in mass is shown, and trend 2 is below the x-axis, where a decrease in mass is shown. Trend 1 shows that as the molarity of the solution decreases, the percentage increase in mass increases. Trend 2 shows that as the molarity of the solution increases, the percentage decrease in mass increases.
Trend 1:
This shows that the water potential of the potato is less than the sucrose concentrations between 0M (distilled water) and 0.32M. This is shown by the increase in mass. The less concentrated the sucrose concentration, the bigger the increase in mass. The cells absorb the water, and this leads to them becoming turgid. This is when the cells become firmer due to a lot water inside the cell, which makes it bigger, and therefore the cells press against each other. This is why the cells felt firmer.
Trend 2:
This shows that the water potential of the potato is more than the sucrose concentrations between 0.34M and 0.5M. This is shown by the decrease in mass. The different decreases in mass are defined by the different water potential gradient (see above). Water moves out of the cells by osmosis, down the water potential gradient. As there is less water in the cells, they become flaccid and the potato chips become softer. This is why the potato chip felt softer in higher concentrations of sucrose.
Diagram 1:
(What happens during trend 1)
Water molecules
Potato cytoplasm
Sucrose solution
Diagram 2:
(What happens during trend 2)
My results are as I predicted (see planning section).
However the following things could have affected my results. These are the variables, which I tried to keep the same.
I had 3 anomalies in my results. They are highlighted on the 1st graph (raw data). Any of the above points could have caused these anomalous results.
If I had more time I would extend my investigation by using the 0.5M –1M concentrations, using salt solutions and by changing the vegetables. I would also see what happens if the potato chips are left in the solution for less/more time. Hopefully this will improve my understanding of osmosis, and what affects it.