Using these readings, I will calculate the resistance at each length along the wire. To do this, I shall divide the potential difference recorded at every stage by the corresponding current to find three resistances (measured in ohms) at each length. I will then determine the average resistance for each of the 8 lengths measured by adding the three resistance totals together and dividing the sum by 3.
This experiment will be completed in one day so the air temperature should remain constant making the experiment fair. I will use the same piece of wire for every reading to keep my results accurate. The same protective resistor will be used in my circuit to attempt to keep the wire at a constant temperature. To help ensure a constant temperature, I will switch the equipment off between readings to prevent the circuit from overheating. A constant temperature is important as a hotter wire or more current will increase the resistance as it increases the kinetic energy of particles in the wire.
I will also use a micrometer at every 10 centimetre interval on my wire to check that the wire width remains constant along the wire. This width will be included on my table of results. I will take the readings three times at every point and if anomalous results are detected, the readings at that point will be repeated.
I will use a high degree of accuracy for my readings to ensure that they give precise results. I will measure and record my lengths to the nearest millimetre. My current readings will be recorded to the nearest hundredth of an amp and my voltage readings to the nearest hundredth of a volt.
I chose to measure every 10 centimetres between 10 and 80 centimetres as this provides a wide range of results. The results are evenly spaced so they are easier to interpret. I will take averages at each interval so that my results are more accurate and will fit easily with my prediction.
I must also consider safety in this experiment. While I carry out this method, I will ensure that there are no trailing wires for anyone to trip over. I must also ensure that nobody comes in contact with the protective resistor during my experiment as during my pilot test I found that this became hot.
Prediction
I predict that as the length of wire increases so will the resistance. I believe this because as the current travels further, it loses some of it’s energy and therefore, the resistance against it is increased. Georg Ohm discovered that the potential difference or voltage across a metal wire is proportional to the current running through it, for example if you double the current, the potential difference across the wire would also double. This is the basis of Ohm’s Law.
I predict that if the length of the wire is doubled so will the resistance be. As resistance is caused by electrons bumping into ions within the wire, if the length of the wire is doubled, the electrons bump into twice as many ions so there will be twice as much resistance. Therefore, resistance is directly proportional to length of the wire.
Electrical charge is made up of electrons (tiny negatively charged particles). These flow around the circuit as the current. When these hit the particles in the wire, they are slowed down. This ‘slowing down’ is called resistance. If the wire is longer, the electrons have more chance to bump into the particles in the wire and therefore the resistance is increased. This is why I believe that doubling the length will cause the resistance to also double.
Metals are good conductors as due to their properties, they lose electrons easily. This creates free negative electrons that carry a negative charge through the wire.
A formula used in resistance is
Where R is resistance, the resistance of the material, l the length and A the area or diameter of the wire. This formula shows that resistance is directly proportional to the length of the wire, as I predict my results will display.
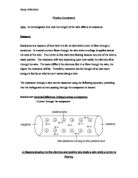
The metal wire is like a latticework that allows electrons to pass through it. Here is a diagram of this.
My Results
I have recorded all of my results in a table. Nichrome wire was used in every reading and all of my results were measured to the nearest centimetre. At this stage there does not appear to be any anomalous results in my readings.
On my spreadsheet, I have calculated three individual resistances. I have then used these to find the average resistance which I will use later in my experiment as it is a more accurate result.
Analysis of my Experiment
My graph shows that generally my results do follow a specific trend. It is a straight line graph, which shows that the wire length and resistance are proportional. As the wire length doubles, so does the resistance on my graph. Take for example the points of 30 and 60 centimetres. From my graph, I can see that resistance at 30 cm is 4.47 (2.d.p.) and the resistance at 60 cm is 8.98 (2.d.p.). This shows an increase of approximately 49.78% so we can see that the resistance is doubling. These results appear to be the most accurate in accordance with Ohm’s Law, which states that yet all the points follow the general fashion.
This shows us that longer wires do have greater resistance, due to the greater number of particles that the electrons have to hit against as they travel along the wire. This is also affected by the resistivity of the wire (the power of the resistance).
This relationship is proportional, as my graph shows. As the wire length doubles, the resistance does as well. This is correct in accordance with Ohm’s Law at a constant temperature. The concept that as length increases so does resistance is used in a rheostat. This a variable resistor often used in circuits to vary the current. There is a sliding contact positioned on it. As this contact moves, the wire length varies. This rheostat can be used in dimming theatre lighting.
My results do support my prediction well. I predicted that as the wire length doubled, so would the resistance of the wire, which is exactly what my graph shows to happen.
Resistance depends on many factors. In this experiment we have proved the formula
l in this formula is the length, p the resistivity of the nichrome wire, and A the cross sectional area of the wire. This equals R, the resistance.In this experiment the resistivity has been kept constant as we have used the same wire. The area or diameter of the wire which I have measured using the micrometer has also been kept constant. We have changed the length of the wire to vary this equation.
The resistance of the wire increased because as the wire length doubled, the electrons travelled twice the distance and therefore collided with twice as many of the metal ‘lattice works’ in the wire. The diagram below shows electrons trying to pass through a metallic wire.
Evaluation of my Experiment
In this experiment, I used a digital voltmeter and ammeter to take my readings. These should provide accurate results. These recorded the potential difference and current respectively to two decimal places (2.d.p) I waited for the reading on these pieces of apparatus to settle before I recorded the result In general the figure on the screen was steady which proves that my experiment was quite accurate.
I did not obtain any anomalous results. If I had, I would have circled and repeated them. The new points would then have been plotted instead.
The majority of my results do sit exactly on the line, however my method could have been more accurate. I could have measured my results to a greater degree of accuracy. I could also have ensured that my protective resistor did not heat up at all by switching the power pack off between each reading. If the protective resistor did heat up, its resistance could be lowered, meaning more current was sent to the nichrome wire, causing this to heat up again affecting the resistance of the wire.
My method could have been improved if I took more readings at each wire length. This would make my average more accurate meaning I would have a more accurate average resistance. This would in turn make my graph more accurate. I could also test a greater range of wire lengths with smaller intervals, for example 5cm. This would allow me to see whether my prediction worked over a greater range of wire lengths but as my results were quite accurate every 10cm, this is not really necessary.
My experiment could also lack in reliability. For example, I cannot be sure that my crocodile clip connected exactly 10 centimetres from my first point. To make the experiment more accurate, I could ensure that the centre of the crocodile clip was placed precisely at the relevant point, for example 10 centimetres away.
My equipment may also have been unreliable. If the voltmeter or ammeter was old or had been used a lot, it may not be as reliable as a new one could be. To improve the accuracy of my readings, a new voltmeter and ammeter should be used in the circuit. The ammeter and voltmeter could also be exchanged after the readings had all been taken and the experiment repeated to test the accuracy of the results.
I am also unsure whether my protective resistor was kept at a constant temperature, as I did not record this. It would be very difficult to record the temperature of the resistor as this may vary at different points on the resistor. Ideally an ohmic resistor should be used as this would create a more accurate set of results.
Further Experiments
For a further experiment, I would like to change the diameter of the wire used. According to Ohm’s law, this would halve the resistance, as there are more ‘channels’ for the electrons to flow through. This relates back to the formula
This shows that resistance is inversely proportional to area. This means that as one doubles, the other halves.
I would set up the experiment in a circuit similar to the one used for this experiment. I would keep the wire length constant at 30 centimetres to make the experiment fair and change the wire for pieces of the same metal, nichrome and length but with different cross sectional areas. The diameter of each piece would be measured using a micrometer. This experiment would be more difficult to control as the wire length may be difficult to keep constant.
To record the results of this experiment, I would again read the potential difference and current from a voltmeter and ammeter and using the formula R = V calculate the resistance. Again, I would repeat
I
The experiment 3 times with each diameter and record an average.
Another possible experiment would be to change the wire material. This would mean that the wire diameter and length would need to be very accurately checked in order to create a fair test. This would give us information about the resistivity of different metals and would be an interesting experiment to carry out. I would try different metals such as copper, Iron and lead and use the formula R = V to calculate the
I
resistance. I would then rearrange the formula
and insert the resistance recorded to calculate the resistivity of each metal.
The wire temperature could also be adjusted, with the same length and diameter of wire used. This could be achieved with resistors varying in strength. It would be difficult to keep the wire at a constant higher temperature, however. In this experiment, as heat increases the kinetic energy of particles in the wire and therefore speeds up the movement of the electrons within the wire, I would expect the resistance to be higher at higher temperatures due to an increased number of collisions.
Bibliography
Physics for you – Keith Johnson
Physics ‘A’ level revision – Stephen Pople
Complete Physics – Stephen Pople
Letts A level Physics study guide – Jim Breithaupt and Ken Dunn