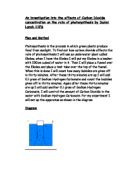
Diagram
Equipment List-this is a list of everything I will need in my experiment
Beaker
Test tube
Funnel
Elodea
Scales (for sodium hydrogen carbonate)
Sodium hydrogen carbonate
Water
Elodea
Fair Test and Limiting factors
There are many limiting factors in my experiment, many of which are incorporated into whether or not my test is fair.
The first limiting factor in my experiment is temperature. The temperature must stay the same if I am to have a fair test as if the temperature rises then there would be more collisions between water and plant particles, therefore producing more oxygen. Also sunlight is a limiting factor, if there is too little sunlight there may not be enough for photosynthesis to take place, this would mean less oxygen would be produced. Sunlight also can affect a fair test in another way as if there is too much of it the temperature may start to rise, causing the particles to collide more frequently thus producing more oxygen. I will keep my test a fair by keeping my experiment in the same temperature and in the same place. The Elodea that I choose is also an important factor in a fair test as the Elodea are not always the same. If my piece of Elodea were smaller than another then I would expect it to have less chlorophyll, therefore producing less oxygen. To keep my test fair I will use the same piece of Elodea each time. Water would normally be a limiting factor in the process of photosynthesis, however this will not be the case in my experiment as the beaker will be full of water.
Carbon Dioxide will be the limiting factor in my experiment
Prediction
I predict that the more Sodium Hydrogen Carbonate added to the water, the more carbon dioxide particles there will be to collide with the plant particles; therefore I predict that more oxygen and glucose will be produced by the Elodea. However my predicted graph result shows that the oxygen concentration will just keep on getting steadily higher, this graph does not show what would happen if the experiment were to go on for longer, if my experiment were to go on for longer then I predict that the limiting factors would level off the amount of oxygen concentration on the graph.
Predicted Graph result
Collected results for one of the trial experiments recorded in a table
Analysis
In my experiment I have found that Carbon Dioxide greatly affects the rate of photosynthesis: utilizing my graph I have found that the more carbon dioxide added to the water, the more oxygen was given off. By utilizing my graph and collected results table I was able to see that my prediction was right although I have not compensated for limiting factors being depleted after a long time. I am pleased with my results as they back up my original prediction.
Evaluation
Generally my results were conclusive as I managed to get a line of best fit on my graph. However there were some anomalous results, which do not fit my predicted results or the pattern of my actual results. I have circled these results on my graph and highlighted them on my table. There are quite a lot of possibilities that could of caused these anomalous results. These include variations in bubble size, not all of the bubbles were the same size. Therefore some may of gone by unnoticed. Also bigger bubbles would have more oxygen in them, the predicted result pattern was mainly relying on the bubbles all being the same size. Also some bubbles may have stayed on the Elodea and not risen to the surface. These bubbles would not of been accounted for.
If I were to do the experiment again I would make improvements to achieve more conclusive results, for example I might do it the way we originally planned by collecting oxygen given off in a measuring cylinder, this is a much more accurate way of doing the experiment as I am measuring gas not bubbles and I wont have to worry about the size of bubbles. If I were to do further work on this experiment I would continue investigations by adding more carbon dioxide until my graph levelled off.