Because I am only investigating the change in frequency caused by a change in length of the string, both the tension and the mass per unit length of the strength need to be kept the same to get accurate results.
Method
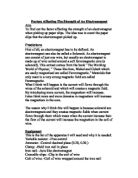
To keep the Mass per unit length of wire the same, I am going to use the same piece of constantan wire for all my results, which has a mass per unit length of 32 (swp). The tension can also be controlled by using a constant mass suspended from one end of the wire.
Diagram
The mass I chose to use is 1000g, because it provides a good tension making it easier to produce clear standing waves.
Using the signal generator which will be connected to either end of the length of wire, different frequencies can be used to create standing waves down different lengths of wire.
I will use different lengths of wire to see what frequency is needed to produce a clean standing wave, which can be seen by the magnet’s field interacting with the electric field causing a movement in the wire at a 90° angle. Therefore it will be obvious at which frequency the wire oscillates also because a note, like a hum, will be produced.
The lengths of wire I will use can be changed from 100 cm to about 40 in 10 cm intervals by measuring with a metre stick, accurate to a mm, to the place on the wire where the moveable node needs to be.
Although you can read off the signal generator what the frequency needed to make the wave is, it is very inaccurate as it only reads off to the nearest Hz. Therefore, I decided to link the signal generator to the cathode ray oscilloscope and use the graph created on the screen to read off the time period, as this can be used to find the frequency of the wave.
By putting the graph as each square on the screen = 2milliseconds, you can produce a wave which is easier to use to count the number of squares between 2 troughs of the wave to find what half the time period would be, and then to multiply it by 2 to get the time period, and then divide 1000 by the answer to find the frequency in Hz.
I also worked out that there would probably be an inaccuracy of about +/- 0.4 milliseconds as it is quite hard to judge exactly where the troughs of the waves are. I can use these to plot a more accurate graph.
The only safety precautions that need to be taken are making sure all the wires are connected properly, and the tension is not too high so as it might snap.
Observations
When I was collecting results, I found it quite difficult to judge when the wire was resonating at its correct frequency, it tended to change from being constantly moving to beating with little change in the frequency. This is possibly the explanation for the anomalous results.
It was also quite hard to judge on the CRO screen where the troughs of the waves were, and because of that, the inaccuracy is quite large when it has been plotted.
When the correct frequency was found, the wire began to resonate quite violently, and sometimes produced a humming noise as expected. However, on one result I suspected that one of the pieces of paper we had placed under the wire was interfering with the wire’s vibrating, creating another node, and this may have caused the frequency to be higher than it should have been.
Analysis
From the results gained of the Time period, I was able to calculate the frequency using the equation ƒ = 1/Time period. I also used this equation and the inaccuracy value of about +/- 0.4 milliseconds to create a graph showing how inaccurate the experiment could have been. I was also able to use the lengths of wire I had measured multiplied by 2 to get the Wavelength of each wave.
However, from that graph, I was able to see a curve signifying that the frequency was inversely proportional to the wavelength of the wave. One way of checking this was to plot the wavelength against the reciprocal of the frequency, which showed a straight line, but with several anomalous results which I didn’t pick up on when I plotted the first graph during the experiment, and had I done so, I would have taken repeats.
From my results I can see that as you increase the frequency, the pitch of a note increases, as the humming got higher, and this depends on how short the wire is. This is why, on a guitar, moving your hand up the fret board and shortening the string makes the pitch of the note produced higher.
Evaluation
Although my graph shows that frequency is inversely proportional to the wave’s wavelength, it is obvious from the amount of anomalous results, and the predicted inaccuracy value, that my results are not that accurate.
When measuring the length of the wire, and changing the length of it with the moveable node, I could have made some significant error which would have changed the frequency needed to create a standing wave. The pulley used to keep the tension the same was also quite stiff, and could have changed the tension had it been moved a little bit. Also the possibility that one of the pieces of paper could have been a node could have had quite a large effect, possibly explaining the change in results at 80cm. One way which this could have been avoided was to use coloured wire, and a way of avoiding the inaccuracy caused by the metre rule would have been to have used a piece of equipment which had a length measurer incorporated into it.
When turning the dial on the signal generator, it was very hard to turn it precisely enough to create the right frequency which would have made the wire resonate, and sometimes it could have been seen beating which signified that the frequency was not correct. This could have been avoided by having a more sensitive signal generator.
The CRO display was very hard to read off of, and probably increased the inaccuracy. If it had had smaller gridlines, or an indication of where the troughs of the wave were, then the results would have been more accurate.
Altogether, the inaccuracy which is plotted on my graph seems about right, and the experiment could have been improved by using more sensitive equipment, possibly a computer, to show that frequency is inversely proportional to wavelength, i.e.:
ƒ = v / λ