Repeat experiment 2 but these times measure out 20cm³, 30cm³ and 40cm³ of distilled water and, 30cm³, 20cm³ and 10cm³ of HCL.
Preliminary Experiments
I have carried out several preliminary experiments to find out what quantities of materials I will use and whether my method will work or not. My first preliminary experiment was to determine how much concentration of HCL I would use.
Preliminary Experiment 1
First I used 3M HCL with a 5cm Mg ribbon. I set up the apparatus the same way as my final method. When I first added the 3M HCL to the 5cm Mg ribbon, the reaction was too fast so I was unable to get enough results in the time I was taking the amount of hydrogen produced. I recorded the amount of hydrogen produced every 10 seconds and the results were too varied and I didn’t get enough of them. This meant that I needed to use a larger amount of Mg ribbon and take the results at a quicker time. When I repeated my experiment again the results were different from the first. This was because I put the Mg ribbon in the side arm conical flask before I put the 3M HCL in. This meant it wasn’t as accurate each time and I started the stop clock at different times in each experiment. Therefore, I decided to put the HCL in the side arm flask before I put the MG ribbon in which made my results (when done twice) a lot more similar and accurate. The volume of HCL, which I used, began with 5cm³ without any distilled water then I repeated my final method but using 4cm³, 3cm³, 2cm³ and 1cm³ of HCL and 1cm³, 2cm³, 3cm³ and 4cm³ of distilled water.
Preliminary Experiment 2
I used 7cm of Mg ribbon in this experiment and set up my apparatus the same as my final method. The time in which I took my recordings of the amount of hydrogen produced was every 5 seconds. I used 3M HCL again. This reaction was still fast but I was able to take more results in the beginning of the reaction as it slowed down towards the end. The results which I had, were still too varied and the experiment finished too quickly. I knew I needed a lot of results towards the beginning of the experiment so I could test my prediction more accurately. This meant I needed lower concentration of HCL and again, I needed to record the amount of hydrogen produced quicker.
Preliminary Experiment 3
In this preliminary experiment I used 2M HCL and set my apparatus the same as my final method. I took my recordings of the amount of hydrogen produced every 2 seconds and I decided to use 10cm of Mg ribbon so the reaction as a little slower so I had more time to record more results at the beginning of the reaction. The most important results are at the beginning of the experiment so this worked quite well but the reaction went too slow and didn’t reach its maximum production of hydrogen in 30 seconds which was were I wanted to stop the reaction. I decided the reaction was slow due to the volume of HCL and distilled water I was using. I decided to increase each volume by using 10 times more HCL and distilled water. This meant I would use 50cm³ of HCL to start with. I would then use 40cm³ of HCL but add 10cm³ of distilled water followed by 20cm³, 30cm³ then 40cm³. This meant I would decrease my volume of HCL by starting with 50cm³ then 40cm³ followed by 30cm³, 20cm³ then 10cm³. I decided that this preliminary experiment showed me how much volume of HCL and distilled water I would use and how I would vary them. It also showed me exactly how much Mg ribbon I would use and what concentration of HJCL I would use.
The results of my preliminary experiments were:
Preliminary Experiment 1 Preliminary Experiment 2 Preliminary Experiment 3
5cm³ HCL 4cm³ HCL 3cm³ HCL
0cm³ Distilled Water 1cm³ Distilled Water 2cm³ Distilled Water
Preliminary Experiment 4 Preliminary Experiment 5
2cm³ HCL 1cm³ HCL
3cm³ Distilled Water 4cm³ Distilled Water
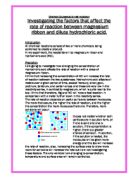
Fair Test
To achieve a fair test in the experiment we need to list the factors, which could have an effect on the rate of the reaction in this particular experiment. These are the factors:
- Temperature – kept the same at room temperature
- Concentration of HCL– varied
- Volume of HCL – varied
- Size of Mg ribbon – kept the same at 10cm
- Volume of distilled water – varied
- Presence of catalyst – none
Obtaining Evidence
I repeated each experiment 3 times then I took the average. This was to make my experiment more accurate so it would be easier to test my prediction. Here are the results of my experiments:
Expt 1: 50cm³ HCL Expt 2: 40cm³ HCL
0cm³ Distilled Water 10cm³ Distilled Water
Expt 3: 30cm³ HCL Expt 4: 20cm³ HCL
20cm³ Distilled Water 30cm³ Distilled Water
Expt 5: 10cm³ HCL Average results
40cm³ Distilled Water
Results
Once I had finished my experiment, I collected my results into a table:
Analysis
Once we had finished the experiment we gathered our results into a table. But we had to calculate the concentration of the diluted HCL solution and the rate of the reaction for our table to be complete. To do this we used the following equation:
Conc of HCL after dilution = (conc of stock soln) x (volume of stock soln)
Total Volume
Total volume = volume of water x volume of stock soln
I’m going to show one specimen calculation for experiment 2:
Experiment 2
Conc of HCL after dilution = 2.0 x 40 = 2.0 x 40 = 1.6M
(40 + 10) 50
To work out the rate of the reaction I had to plot a graph of my results with the time on the x-axis and the amount of hydrogen produced on the y-axis. On this graph I drew a curve. The rate of the reaction is measured by the steepness of the curve, which is its gradient at the beginning of the reaction because this is where the rate is at its fastest. To find this I drew a tangent to the curve and calculated its gradient:
Gradient = Rise
Run
To calculate the rate of the reaction I used the formula:
Initial Rate = Rise
Run
I’m going to show one specimen calculation for experiment 1:
Experiment 1
Rate = 90 = 18s‾¹
5
With these results I drew a graph with the rate on the y-axis and the concentration of the diluted hydrochloric acid on the x-axis. This is the factor I am trying to find the effect of. On this graph I drew a curve of which I found no anomalous points. I have drawn a table of the points which I have taken off the graph and used this to help me to test if my numerical hypothesis is correct. In my hypothesis I said the rate of the reaction was directly proportional to the concentration of the HCL solution. Therefore as the concentration of the solution doubles the rate of the reaction would double also. To test if my prediction is correct, I have taken three sets of two points from my graph. To do this I’m going to use the following equation:
Rate 1 = x
Rate 2
Rate 1 is always double rate 2 so for my prediction to be correct then x should equal 2. Here is a table of my results:
In my results I expected to see the concentration of the HCL solution double so the rate would double also. I used the collision theory in my hypothesis, which states that if the concentration of the hydrochloric acid doubles, the rate would double also. This is because the rate of the reaction is directly proportional to the concentration of the hydrochloric acid. I worked this out by using the collision theory, where if you change the concentration, the rate changes in the same proportion.
Evaluation
I had no anomalous points although one wasn’t one the curve which may be because inaccurate timing or measurements of the solutions.
Conclusion
I can conclude that if you double the concentration of the acid the reaction rate would double also, this is because the numbers of particles are closer together in a concentrated solution. The closer together they are, the more often the particles collide. The more often they collide, the higher the chance of a reaction between the magnesium ribbon and the hydrochloric acid. If you double the concentration of the hydrochloric acid , the number of particles in the hydrochloric acid would double also. Therefore, the number of collisions between the particles will double so the rate would double also. This means that the rate of the reaction is directly proportional to the concentration of the hydrochloric acid. I worked this out by using the collision theory, where if you change the concentration, the rate changes in the same proportion. The graph gives us a good device to prove that if you double the concentration the rate doubles also.
Sources of error and limitations
- I assumed that the room temperature was constant throughout the experiments.
- The stop clock was unreliable and sometimes inaccurate because the second – hand was loose and would move if it were tapped.
- The measuring cylinders used to measure the distilled water and HCL solution was only accurate to ±1ml, so they’re slightly inaccurate.
- I washed and dried all our equipment but during the experiment dirt could’ve entered the side arm conical flask or water droplets could’ve been left in the flask.
- When the reaction takes place bubbles of hydrogen are given off, which might stay around the magnesium, which therefore reduces the surface area of the magnesium and so the acid cannot react properly so this affects the results.
- I could have stirred the solution more with a spoon because if this is not done properly it can lead to inaccurate results.