Stands for cross sectional area.
The I stand for current/amps.
Resistance
Resistance is the property of a material, which restricts the flow of electrons i.e. restricts the current as the resistance goes up, rate of flow of electrons goes down, which also means current goes down.
OHMS law
From my previous knowledge current is proportional to voltage (I is proportional to
v) Provide temperature remains constant, i.e. v = I x R therefore R = V/I.
Electric current
An electric current is a flow of charge. The flow of charge is carried by a conductor. The SI base unit of electric current is the ampere. Electric current has the symbol I and the ampere has the symbol A.
A quantity of electric charge is measured in coulombs (symbol c). A coulomb is the quantity of electric charge carried by one ampere in one second (symbol s) thus:
1 C = 1 A s
Electric charge is driven through a circuit by an electrical potential difference. This has the symbol V. The SI unit of potential difference is the volt which also has the symbol V. one joule of work is performed when one coulomb of charge is transferred through a potential difference of one volt. Thus:
1 V = 1 J A -1 S -1
Potential difference is related to electrical current by ohm’s law:
V = IR
R is proportionality constant called resistance. The unit of resistance is the ohm. This has the symbol . One volt is required to drive an electric current of one ampere through a resistance of one ohm. Thus:
1 = 1 V A -1
The reciprocal of electrical resistance is the electrical conductance. This has a symbol G. the unit of electrical conductance is the siemens, S.
Thus:
1 S = 1 -1
the length and cross-sectional area of a conductor are related to its resistance by a property known as resistivity. The relationship is:
P = AR
L
Where P is the resistivity, A is the cross-sectional area with units M squared and L is the length of the conductor with units M. The units of resistivity are ohm metres,
Metres.
Flow of electrons
A flow of electrons causes a current. Resistance is caused by obstruction to the flow of charge (free electrons). If the metal is pure, crystal lattice is very regular. The electrons will then flow through easily because there will be lots of straight routes for the electrons to follow. If a positive ion gets in the way of an electron, then the electron will collide with the ion.
Variables
Factors which can change the resistance of wire:
- length of wire
- thickness of wire
- temperature of wire
- Material wire made from.
Prediction
Well I predict that, in the case where the length of the wire is varied, as the wire becomes longer the resistance of the wire increases. I also predict that the resistance is proportional to the length of wire. So as the length of the wire increases in equal steps, so does the resistance in equal steps. I predict this because if the length of wire increases there are more atoms so free electrons collide more. So the temperature increases so then resistance increases. Double the length, double the ions, double the electrons so double the resistants.
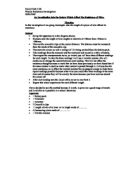
On this page I have input a diagram to make my prediction clearer.
Here I have input a diagram to specify what I am saying for my prediction:
Here you can see there is a smaller length of wire then of the opposite. There are more atoms on the longer length of wire which collide more so therefore causes a greater resistance.
Preliminary work
As with any investigation, preliminary work is an important target which must be applied especially this investigation being an investigation which has to be worked through properly, so I have done some preliminary work to get the best possible and reliable results.
Preliminary work is important because you have to establish:
- Use of material which will allow you to make a suitable number and a range of results.
- Maximum voltage and current that will produce less current.
- The ammeter and volt meter use covers the expected range.
- Lengths of wire chose which are unlikely to get hot.
- Thickness of wire that the wire is unlikely to get hot.
There are I think three different wires that we got to chose from and they are nichrome, constantant and copper. They all come with different cross sectional areas that we could chose from as well.
I have added a preliminary work results table to identify the wire suitable for the experiment.
Here is a preliminary work results table:
We chose the wire ‘nichrome 32’ because it has a low resistance at the length of 10 cm.
List of apparatus
- Power pack
- Variable resistor
- Ammeter
- Voltmeter
- Test wire
- Other wires to connect it all up
- Pen
- Pencil
- Rubber
- Ruler for accuracy
- Crocodile clips.
Method
First we will set up a circuit using a power pack, variable resistor, ammeter, voltmeter and my test wire. The wire that I am going to use is nichrome 32 as its resistance undergoes little change with slight changes in temperature. I will place the small copper thin piece of metal because it is a good conductor. Then I will place that from 100cm and recording the current in amps and the p.d in volts, and then I will work my way down to 10cm of length wire. I will be switching of the power pack regularly so the temperature does not rise in the wire which will cause an increase in resistance. For each reading that I will get I will divide the voltage by current to give the resistance of the wire. Then I will plot a graph of voltage against amps and then take the gradient to give me another more accurate reading for the resistance of the wire.
Fair testing
In this experiment, to make it a fair test, I will keep any other factors that affect the resistance of the wire constant. First of all I will have to keep the temperature same and keep current as small as possible. If temperature is different then the atoms in the wire will vibrate differently and therefore the resistance would be different. To keep the temperature same I will have to turn the power pack off each time to keep the temperature constant. I will also keep the temperature below 4 volts so the wire does not get hot.
I would also repeat the experiment so that results are more reliable, so if results are more or less identical which suggest that the results are reliable. To make my results more accurate I will have to measure ammeter and voltmeter from eye level to get exact results.
I know I would not be 100 percent accurate because the ammeter and voltmeter needle flickers on the meters. So I will have to get the percentage error, by doing the following formulae:
Part divided by whole x 100 = % error.
I will also have to make the wire as straight as possible, and I will do this pulling on both sides of wire hard and then put sticky tape at the ends. I could also work out the percentage error for the wire too. I will avoid touching the rest of the wire while the current is flowing as it is possible it may get hot.
Conclusion:
Graph four gives a reasonable straight line, which shows a positive correlation between the length of the wire and the resistance of the wire. This shows that an increase in the length of the wire give an increase in its resistance, it also suggests that the resistance is directly proportion to the length of the wire. This is an agreement with what I said in my predictions.
So my predictions were correct and I can explain in scientific terms that the resistance to an electric current is probably vibrations of the metal ions in their lattic positions. These vibrations restrict the movement of electrons and thus restrict the current.
Each time an electron collides with an ion, it loses energy in form of heat and, in turn its speed is reduced. The numbers of collisions the free electrons have with the metal ions, an average will be directly proportional to the length of the wire and hence the resistance is directly proportional to the length of the wire.
By introducing some mathematical formulas I could now say ‘if the resistance, R, is directly proportional to the length of the wire, I, we can say that:
R = KL
Where K is the gradient of the straight line on graph four.
The length and the cross-sectional area of a conductor are related to its resistance by a property known as resistivity. The relationship is:
P = AR
L
Where P is the resistivity, A is the cross-sectional area with the units mm squared and L is the length of the conductor with units M. the units of resistivity are ohm metres.
M.
Evaluation
Well I am generally satisfied with the results that I got because the results I got were quite good straight lines on the graphs.
The little off place of some of he points may have been due to the wire getting hot as the current passed through the wire, and as temperature is the factor that affects the resistance of the wire and this may have caused an increased amount of errors in my results.
There may have been another possible source of error which could have been the slight variations in the diameter of the wire along its length.
Me and my partner who I was working with were trying really hard to decrease the amount of error in our experiments. We took the averages of the resistance to make my result more reliable and accurate. We then, to make our results even more reliable, is we plotted graphs of voltage against current and finding out the gradient of the line of best fit.
This was a successful experiment overall as me and my team worked well and hard at it to achieve the best possible grades. Although we have some difficulties at the start, but gradually as we paid more interest and got on with it my predictions matched up to the conclusion that it clearly showed the resistance was directly proportional to the length of the wire and inversely proportional to the cross sectional area of the wire.
I think the only way of improving our results and making our results more accurate is by using digitalised meters. As I said the procedure was not very accuracy because error due to instrument (systematic error) and human error (random error). If here is ant fault in calibration then that will be carried over to every measurement. A repeated result will make it more accurate.
Avoid parallax error- look from the top. I repeated 3 times and write down average and that’s how I reduced the error, hence: my results look very accurate to me.
Reliability- I kept all the variables same – THICKNESS and MATERIAL. My repeated results appear to be the same; therefore my results must be reliable. If the wire gets hotter, the particles vibrate more, so the resistant increases. The temperature for the shorter length of the wire is more likely to be hotter.
I think I worked well in my group and I hope to do the very best.